2026 Outlook: U.S. Stocks and Economy

Key takeaways
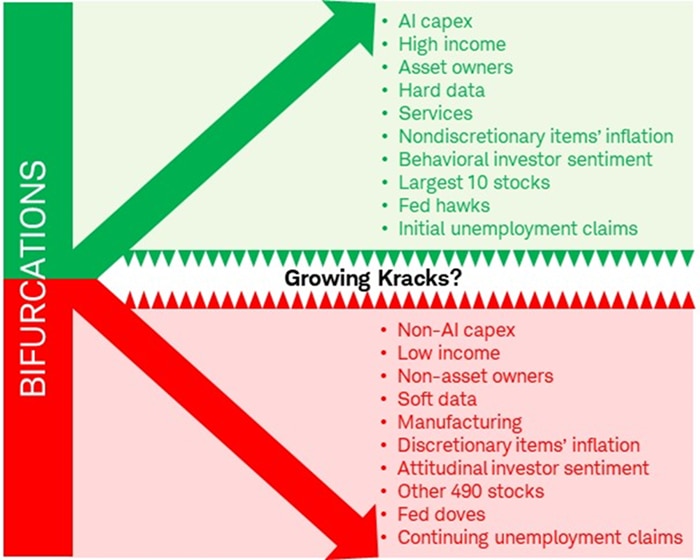
- The current economic and market cycle is characterized by instability rather than mere uncertainty. This instability manifests as rapid shifts in key determinants affecting economic sectors and consumers unevenly, leading to a K-shaped backdrop. We expect that to persist, creating heightened volatility and ongoing rotation within the stock market.
- There are some upside risks to inflation, which we think will remain sticky and closer to 3% vs. 2%. While the labor market is not yet showing signs of recession-level weakness, affordability pressures continue to mount and labor supply will likely stay under pressure, contributing to monetary policy instability.
- The market is likely going to continue to experience ongoing sector rotations, with artificial intelligence (AI) in the spotlight amid concerns about circular financing and capex sustainability. Investors are encouraged to focus on sector diversification away from just Tech and narrative-driven segments in line with expectations of a broadening out of performance.
This unique economic and market cycle is best defined using a couple of key letters: U and K. The u-word most often used to describe the backdrop is "uncertain." We often chuckle when we hear the old adage that "the market hates uncertainty" … as if the environment is ever certain! We believe the more relevant u-word for the current set of macro and market circumstances is "unstable." To date, instability hasn't knocked the stock market off its enviable path higher this year and the market may continue to "climb a wall of worry" in 2026; but we expect ongoing instability is likely to usher in bouts of volatility and sustained high churn and rotation.
Without playing around too much with semantics, "uncertain" implies a lack of clarity (obviously), while "unstable" implies movement, with shifting inputs and relationships happening somewhat rapidly. The current backdrop isn't just unclear, it's fluctuating in real time. Uncertain environments still allow forecasters and prognosticators to build somewhat reliable probability models. Unstable environments bring less reliable probabilities because the underlying relationships are changing in real time. Uncertainty generally assumes exogenous unknowns: elections, wars, Federal Reserve decisions, etc. Instability stems from the inner workings of the system itself, such as:
- Tariffs and their uneven application (contributing to today's K-shaped economy)
- Housing supply frozen by mortgage rate lock-ins
- Corporate profit margins diverging by company size (contributing to the K)
- Labor supply altered by immigration shifts
- Fiscal stimulus and deficits decoupling from the business cycle
- Oscillating inflation components (contributing to the K)
- Stock market breadth narrowing and widening in sharper bursts
"Uncertain" assumes the economy has a single path around which we haven't yet coalesced, while "unstable" means the economy is operating on multiple paths at once. It captures the K-shaped nature of this cycle, highlighted below.
Cycle still brought to you by letter K
©2025 Charles Schwab & Co., Inc. All rights reserved. Member SIPC.
Investing involves risk, including loss of principal. This material is intended for general informational and educational purposes only. This should not be considered an individualized recommendation or personalized investment advice.
Inflation (will be increasingly) on the brain
It's safe to say that inflation—and, by association, affordability (more on that later)—has dominated the post-pandemic economic discourse for multiple reasons. First, the personal consumption expenditures (PCE) price index has been above the Federal Reserve's 2% target for four and a half years. Second, price levels remain egregiously above where they were before the pandemic; and third, there has been upward pressure on inflation from elevated tariffs and a largely resilient services sector.
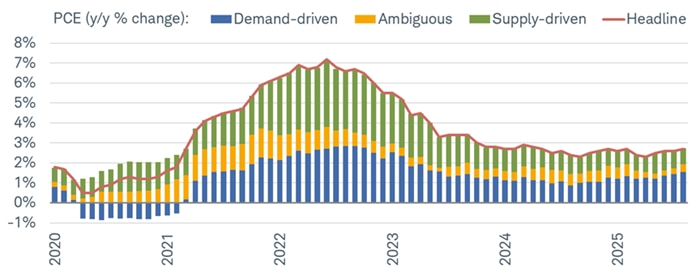
Going into 2026, we don't see much changing along those lines, especially if there isn't a recessionary-like weakening of the labor market. As shown below, headline PCE (on a year-over-year basis) has edged closer to 3%, with an increasing share of the action driven by demand as opposed to supply. That's a better environment for inflation compared to the supply-driven spike in 2022 and 2023. However, if fiscal aid expands, the labor market holds together, and consumer spending stays on track, there is some upside risk to inflation next year—likely capping the number of Fed rate cuts at two or three.
Persistent inflation
Source: Charles Schwab, Apollo, Bloomberg, Federal Reserve Bank of San Francisco, as of 9/30/2025.
Ambiguous includes items not captured by demand- or supply-driven categories.
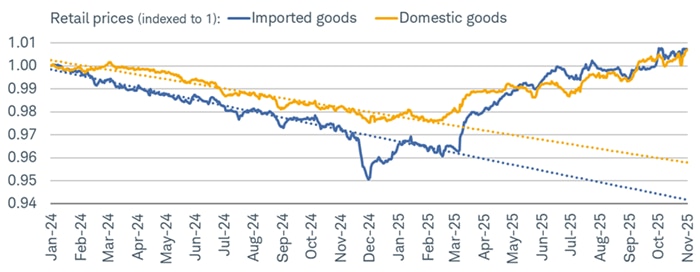
A good chunk of that upside risk might be driven by tariffs, which have already lifted prices on consumer goods by a notable magnitude. As shown in the next chart, analysis from the Tax Foundation shows that tariffs have raised overall retail prices by nearly five percentage points relative to the pre-tariff trend. Intuitively, the increase has been sharper for imported goods; but it's worth noting that domestic goods prices have also moved higher. In other words, tariffs are not only impacting prices on goods coming from overseas, but domestic goods as well.
As a reminder, tariffs are taxes on U.S. importers; they are not (repeat, not) paid by exporters in other countries; which is confirmed by the fact that the Import Price Index remains unchanged this year. While uncertainty associated with tariff policymaking has subsided in the second half of 2025, we think tariffs will remain a dominant macro theme in 2026. We expect to remain in a high-tariff world, with the average effective tariff rate on U.S. imports still well into double digits; and while we think companies will continue to implement cost mitigation efforts (such as low hiring) to avoid steep price increases for the end consumer, there might be thinner profit margins as inventories are worked down.
We also expect another jolt of volatility (hopefully, nothing akin to "Liberation Day") stemming from the Supreme Court's decision on the legality of the International Emergency Economic Powers Act (IEEPA) tariffs. We see little upside regardless of the decision: if the IEEPA tariffs remain, we will likely stay in a high-tariff world as we know it now; if the IEEPA tariffs are struck down, the White House has expressed willingness and determination to implement high tariffs in other ways (Sections 122 and/or 301 of the 1974 Trade Act, for example). The net of this is that higher tariffs are here to stay—persistently contributing to macro instability.
Tariffs boosting prices
Source: Charles Schwab, Tax Foundation "Tariff Tracker," as of 11/1/2025.
Data indexed to 1 (base value=1/1/2024). An index number is a figure reflecting price or quantity compared with a base value. The base value always has an index number of 1. Dotted lines represent trendlines.
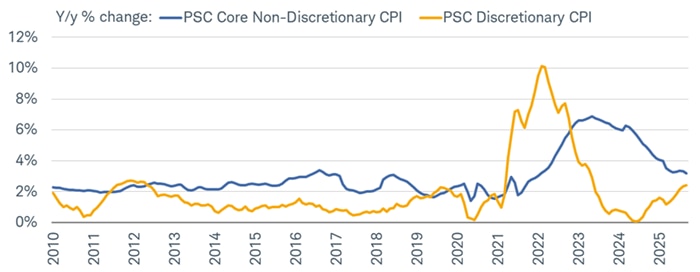
With tariffs raising prices on goods, we think their sticky nature will continue to put pressure on affordability. As shown below, data from our friends at Piper Sandler show that inflation for core non-discretionary items ("needs") in the consumer price index (CPI) has been running above inflation for discretionary items ("wants") for 35 straight months as of September. To be sure, the gap has been narrowing, but the former seems to be settling at a level that is higher than the pre-pandemic average, while the latter is continuing to pick up at a brisk pace, underscoring why there is upside headline inflation risk stemming from the goods sector.
Affordability pressures not fading
Source: Charles Schwab, Piper Sandler & Co. (PSC), as of 9/30/2025.
CPI indexes created by PSC. Core Non-Discretionary categories: Medical Care Commodities, Rent, Hospital Services, Motor Vehicle Maintenance, Motor Vehicle Insurance, Motor Vehicle Fees, Day Care and Preschool, Wireless Telephone Services, Internet Services, Personal Care Products, Legal Services, Funeral Expenses, Haircuts & Other Personal Care Services, Financial Services, Pet Services including Veterinary.
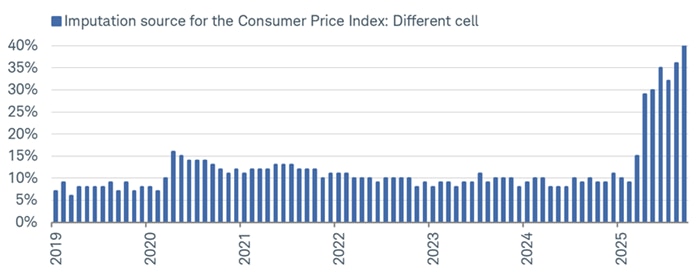
Complicating the backdrop even further is what we think has been an underappreciated risk around inflation. As resource cuts to the Bureau of Labor Statistics (BLS) picked up earlier this year, the agency found itself increasingly lacking in its ability to collect inflation data like it has in the past. As a result, the percentage of items in the CPI was calculated using different cell imputation—an estimate of a price given the lack of ability to collect the actual price of an item—has surged to a record 40%. We don't see this easing markedly anytime soon, barring some major change in funding for the BLS.
In our view, this will likely keep public anxiety around inflation elevated; and while it doesn't directly translate into upward or downward pressure for something like the CPI or PCE indexes, it will continue to cloud the outlook. Not only that, but a new commissioner of the BLS has yet to announced and confirmed. Depending on the individual and what he or she plans for the agency, that has the potential to spark further uncertainty regarding the efficacy of government data.
More inflation guesses
Source: Charles Schwab, Bureau of Labor Statistics (BLS), as of 9/30/2025.
For the CPI Commodities and Services Survey, uncollected prices which are imputed from collected prices within the same item and geographic area are referred to as home cell imputation. This can be contrasted with different cell imputation where uncollected prices are imputed from collected prices of the same item in other geographic areas or from collected prices of related item categories in the same geographic area.
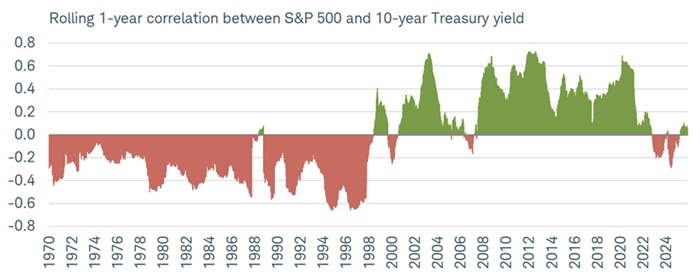
What we lack in government data (due to the shutdown), we can make up for with financial markets—to some extent. One of our favorite ways to show how the inflation backdrop has changed is with the correlation between stock prices and bond yields. Shown below is that relationship on a rolling one-year basis for the S&P 500 Index and 10-year U.S. Treasury yield. One of our higher-conviction, long-term themes (first expressed in the fall of 2023) is that we have exited the Great Moderation that lasted from the early 2000s until the pandemic—when inflation was low and not threatening to markets.
Importantly, we don't think we're back to what we've referred to as the Temperamental Era of the 1970s to the 1990s, but somewhere between both regimes. You can see in the chart that the Great Moderation was marked by a mostly positive relationship between stocks and bond yields—meaning, the market did better when bond yields rose, given better prospects for economic growth. The opposite was true in the Temperamental Era, when inflation was the dominant concern and stocks struggled when yields moved higher.
This new environment is not bad outright—it's just different. We think the world will have to get used to more volatile and stubborn inflation. Importantly, the past few years have taught us that the economy can handle hotter inflation, but it doesn't come without a cost: public backlash, sharp drawdowns in the stock market when yields spike, a Fed that shifts its focus back and forth between its two mandates, and so on. Putting it together, we see some risk that inflation moves higher next year but recognize that if the labor market were to deteriorate faster than expected, a decline in income growth would ultimately be disinflationary.
The Not-So-Great Moderation?
Source: Charles Schwab, Bloomberg, as of 12/5/2025.
Correlation is a statistical measure of how two investments have historically moved in relation to each other, and ranges from -1 to +1. A correlation of 1 indicates a perfect positive correlation, while a correlation of -1 indicates a perfect negative correlation. A correlation of zero means the assets are not correlated. Red shaded area from 1970-late 1990s represents Temperamental Era. Green shaded area from 2000-2020 represents Great Moderation Era. Indexes are unmanaged, do not incur management fees, costs and expenses and cannot be invested in directly. Past performance is no guarantee of future results.
Labor: A headwind and a tailwind
Speaking of labor deterioration, let's move onto the hot (uhm, cold?) topic that is the labor market. Courtesy of the government shutdown, we are publishing this outlook without updated official payroll data for October or November. Payrolls for those months will come out on December 16th (note: there will be no unemployment rate published for October). In the meantime, investors have had to rely on private sector sources like ADP, which show an increasingly soft hiring backdrop.
Through November, ADP payroll data show an average loss of nearly 5,000 private sector jobs over the past three months. If we back up multiple years, we can see that all the stress has been concentrated in small businesses. As shown in the chart below, over the past couple of years, small businesses with 20-49 employees have seen net job losses; firms with more than 500 employees have continued to hire aggressively. For the former cohort, weakness started to accelerate this summer, presumably when businesses started to feel more of a pinch from tariffs.
The small get smaller

Source: Charles Schwab, ADP Research, Bloomberg, as of 11/30/2025.
Data indexed to 100 (base value=12/31/2023). An index number is a figure reflecting price or quantity compared with a base value. The base value always has an index number of 100.
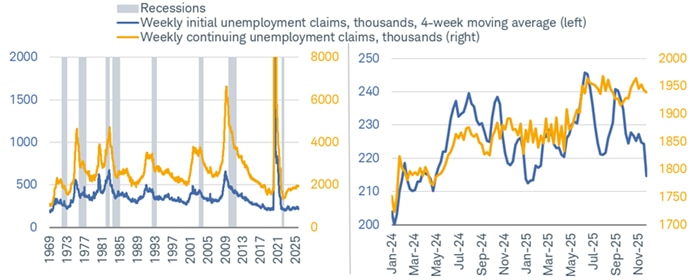
Despite that grim statistic for small companies, weakness down the company-size spectrum hasn't been potent enough to drag down the economy or reflect mass layoffs. As you can see in the chart below, initial jobless claims have remained low and in a tight range this year. The more notable pickup has been in continuing jobless claims (individuals who continue to file for unemployment insurance and cannot find new jobs). The divergence between both series emphasizes a low re-hiring rate in the workforce.
We think these statistics will remain among the most important for gauging the health of the labor market moving forward. As of now, initial claims are following their normal seasonal patterns (that recent decline you see is due to the Thanksgiving holiday). Should they start to move higher, we will turn increasingly pessimistic on the labor market. As of now, though, they indicate little layoff activity for the broader economy. We expect that to persist.
Layoff activity still low
Source: Charles Schwab, Bloomberg.
Initial claims as of 11/28/2025. Continuing claims as of 11/21/2025. Y-axis on left chart is truncated for visual purposes.
When we talk about the labor market also being a tailwind for the economy, we want to emphasize the importance of the stock vs. the flow of labor. The flow is reported each month in the jobs report—e.g., 50,000 payrolls created. The stock is a summation of several months (or years) of flows of labor. Given the stock is at an all-time high of nearly 160 million payrolls, paychecks go out and spending continues. Even if American consumers are doing it reluctantly, they spend money when they're employed.
To be sure, the unemployment rate has continued to inch higher, but it remains incredibly low given how few payrolls the economy has been creating each month. That is almost entirely due to the fact that immigration has slowed to a near halt. This is something we think investors need to get used to heading into 2026, especially if deportations continue and there is very little (if any) net migration into the country. Downward pressure on labor force growth lowers the potential growth of the economy—but so far, the lack of growth from the labor force has been made up for by a pickup in productivity growth.
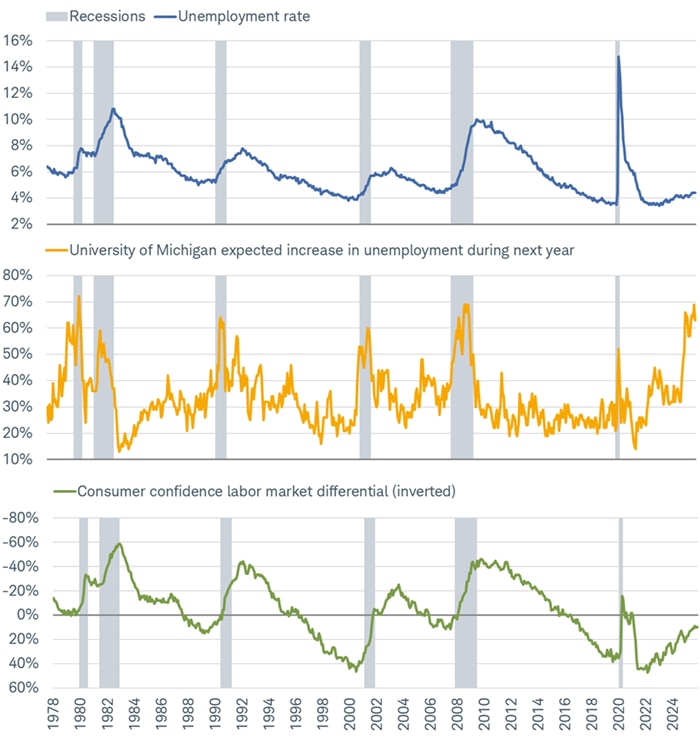
That said, we expect the unemployment rate to continue to rise into 2026—albeit not at a recessionary-like pace—as we continue to see rolling recessions in certain industries (like manufacturing). That should keep the unemployment rate's rise modest. Plus, as shown below, consumers continue to say labor market conditions are weakening. Here is where we need lots of corroborating evidence, though. A survey like the University of Michigan's will tell you that we're deep in a layoff cycle, yet one from the Conference Board will tell you we're not quite there yet. The net of both, however, is that things are likely going to get a bit more difficult for the labor market before they get better (presumably by the middle of next year).
Grim labor prospects per consumers
Source: Charles Schwab, Bloomberg, The Conference Board, University of Michigan. Unemployment rate as of 9/30/2025.
University of Michigan as of 12/5/2025. Consumer confidence labor market differential (as of 11/30/2025) represents percentage of respondents who say jobs "are plentiful" minus percentage of respondents who say jobs "are hard to get."
Who's driving?
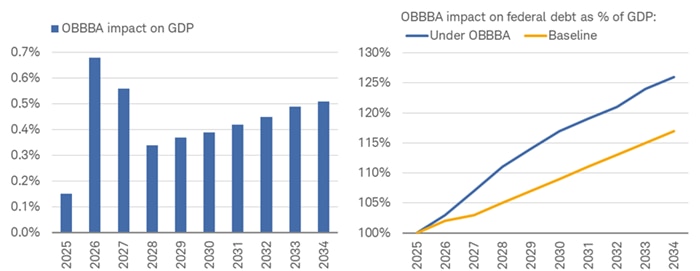
One driver of that turn in the labor market might be the positive growth effects from the One Big Beautiful Bill Act (OBBBA), which provides considerable stimulus to both consumers and businesses. Estimates vary as to the exact boost to GDP, but analysis from the Joint Committee on Taxation, Congressional Budget Office, and Tax Policy Center show nearly a 0.7-percentage-point boost in 2026 (followed by another considerable lift in 2027), as you can see in the left chart below.
That comes at a cost, though. The right chart shows the expected trajectory of the federal debt as a percentage of GDP with and without the OBBBA. The bill results in a much steeper climb in our country's debt over the next decade. If there's one thing we are almost certain will continue in 2026, it's profligate spending by both political parties. The federal debt remains the biggest loser in a polarized environment.
Fiscal stimulus, but with a cost
Source: Joint Committee on Taxation, Congressional Budget Office, Tax Policy Center macroeconomic models, as of 7/27/2025.
OBBBA = One Big Beautiful Bill Act. Please see TaxVox: The 2025 Budget Reconciliation Act Will Increase Debt While Modestly Boosting The Economy for details. Estimates compare debt held by the public under the law currently in place as of 1/1/2025 to a policy adopts all tax and spending provisions of the 2025 Budget Reconciliation Act, as enacted, including the macroeconomic effects and interest costs of the legislation. Forecasts contained herein are for illustrative purposes only, may be based upon proprietary research and are developed through analysis of historical public data.
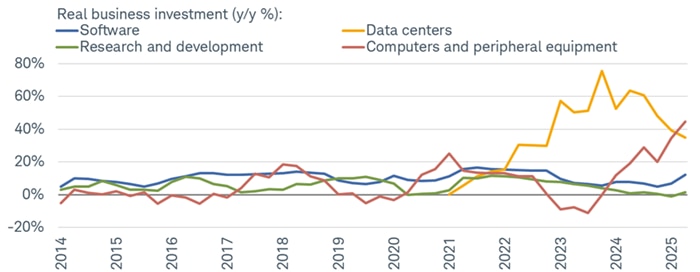
That said, we continue to expect the private sector to do the heavy lifting in 2026. As has been the case over the past few years, private business investment has been a significant driver of economic growth. Most recently and perhaps unsurprisingly, spending on data centers and computers has soared the most. Given we still think there is more runway for the AI buildout, an assist from the OBBBA, and lagged benefits from this year's Fed rate cuts, business investment will likely remain firm.
AI's investment grip
Source: Charles Schwab, Bloomberg, as of 6/30/2025. For illustrative purposes only.
Business investment's dominance won't necessarily come at the expense of consumer spending; we expect the latter to remain positive. However, if the labor market continues to soften at the margin, inflation stays sticky, and affordability doesn't improve, consumption might look less robust in 2026 compared to 2025. That especially rings true if companies' increased investment doesn't lead to a surge in hiring—which is possible if the desire is to invest more in technological, as opposed to human, capital.
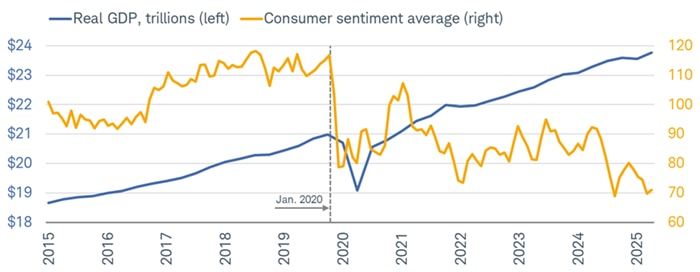
We think that will keep the economy in a "vibepression:" a consumer sentiment depression alongside continued growth in GDP. As shown below, there has been a persistent deterioration in consumer sentiment despite inflation-adjusted GDP reaching new highs each year since the pandemic. After the pandemic, the souring of vibes was initially driven by the inflation spike in 2022 and 2023, but has since been driven by tariffs and AI-related labor anxiety. Given our expectations for sticky inflation, low hiring, and modest firing, we think the "vibepression" will persist. Unfortunately, this is a K-shaped chart that is increasingly moving towards the shape of an I.
The Great "Vibepression"
Source: Charles Schwab, Bloomberg. GDP as of 6/30/2025.
Consumer sentiment average represents average of University of Michigan's Consumer Sentiment Index (as of 12/5/2025) and Conference Board's Consumer Confidence Index (as of 11/30/2025).
Tying macro to market
One of the more striking sentiment bifurcations at present is the clash between the dour expectations for unemployment per the University of Michigan's (UMich) Consumer Sentiment survey and the unusually upbeat outlook for stock prices per The Conference Board Consumer Confidence survey, shown below. UMich respondents tend to be more sensitive to job security, wages, and day-to-day economic stress—capturing "kitchen table" anxieties that have kept recession fears elevated. In contrast, The Conference Board's stock price expectations reflect a more market-aware (and often higher-income) cohort that has been buoyed by rising equity prices, abundant liquidity, and the resilience of corporate profits. The result is a split personality in confidence—textbook K.
Unprecedented divide

Source: Charles Schwab, Bloomberg, The Conference Board (as of 11/30/2025), University of Michigan (as of 12/5/2025).
For illustrative purposes only.
Cycle studies can be a helpful guide to a stock market outlook, although never a gospel. Unless you've been living under a rock, you know we're heading into a midterm election year in 2026. Shown below is NDR's four-year presidential cycle performance pattern. Notable is the fact that this year's performance, after undershooting the historical trend significantly into "Liberation Day" turmoil, has been significantly overshooting the trend since then. That doesn't necessarily mean reversion-to-the-norm is about to kick in, but in keeping with historical trends, we do expect significant market gains to be more difficult to come by in 2026.
Midterm years' dull historical performance

Source: Charles Schwab, Bloomberg, ©Copyright 2025 Ned Davis Research, Inc.
Further distribution prohibited without prior permission. All Rights Reserved. See NDR Disclaimer at www.ndr.com/copyright.html, as of 12/5/2025. Four-year presidential cycle based on average S&P 500 daily price data for each day of the cycle from 1/3/1928-12/31/2024. Data indexed to 100. An index number is a figure reflecting price or quantity compared with a base value. The base value always has an index number of 100. Indexes are unmanaged, do not incur management fees, costs and expenses and cannot be invested in directly. Past performance does not guarantee future results.
S&P 500 presidential cycle performance (1928-2024)
AI arms race and "leapfrog" effect
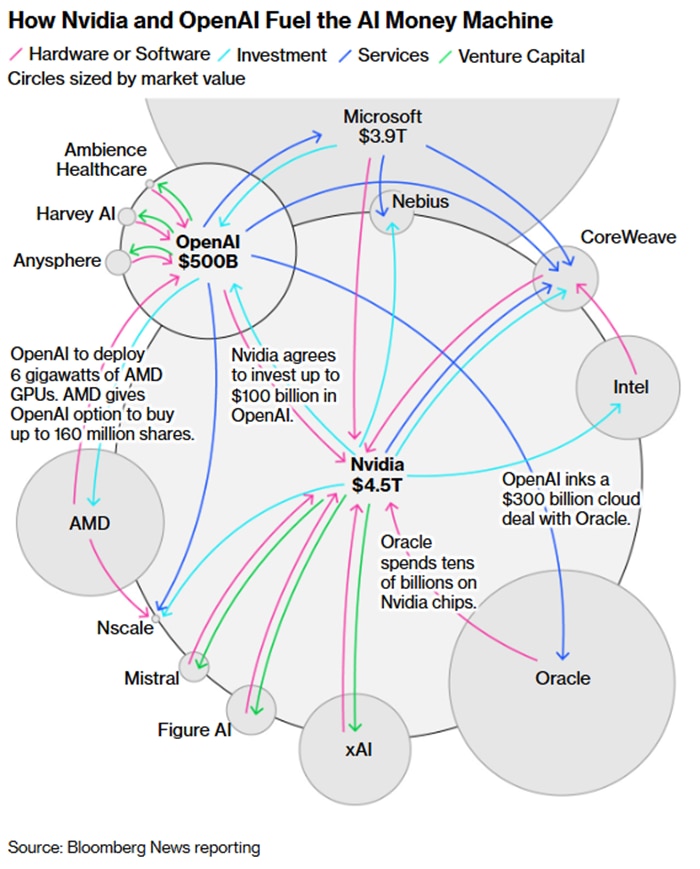
The Bloomberg-created visual below has been making the rounds, rightly so, as it does a terrific job laying out the circular financing concerns in the AI ecosystem. The primary concern is that it creates a self-reinforcing, potentially unsustainable loop of investment and demand that may obscure genuine market value. This structure typically involves a supplier (e.g., a chipmaker or cloud provider) investing capital into an AI company (its customer), which then uses that money to purchase the supplier's products or services.
While this accelerates innovation and infrastructure build-out, critics worry it artificially inflates revenue and valuations, as the capital is simply circulating between a few interconnected companies rather than being driven by broad, external user demand—elevating the comparison to the dot-com bubble in the late 1990s (then referred to as vendor financing). We expect these concerns to persist in 2026.
AI goes 'round and 'round
Source: Bloomberg News, as of 10/8/2025.
All corporate names and market data shown are for illustrative purposes only and are not a recommendation, offer to sell, or a solicitation of an offer to buy any security.
We believe the market could reward AI adopters more than AI enablers, with adopters positioned to benefit by locking in measurable gains in efficiency and innovation. Early adopters are seeing tangible cost reduction from automating routine tasks and driving revenue growth through improved customer satisfaction and faster product development. This creates an AI-driven flywheel, where better data improves their AI models, accelerating their performance, and making it increasingly difficult for slower companies to catch up.
We don't cover individual stocks but are regularly asked about the key players within AI. Below is a handy look at the major companies (both public and private) involved in the Enablers, Monetizers and Adopters categories—courtesy of our friends at BCA Research.
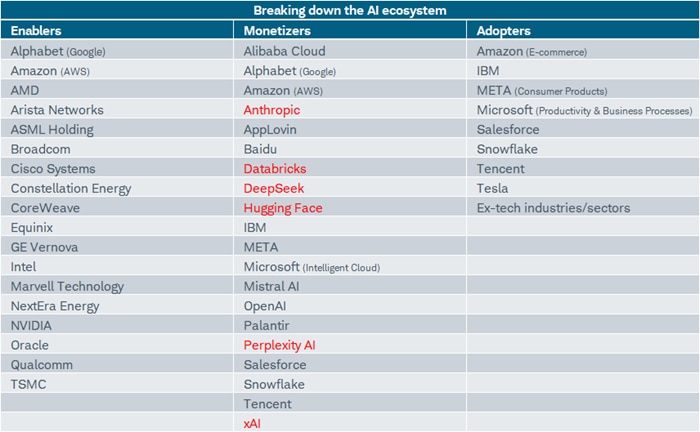
Source: Charles Schwab, BCA Research, as of 12/3/2025.
Enablers=firms providing the infrastructure needed to train and monetize AI models. Monetizers=firms who provide AI software and develop models. Adopters=the end users of the models/software. Entities in red are privately owned. All corporate names and market data shown above are for illustrative purposes only and are not a recommendation, offer to sell, or a solicitation of an offer to buy any security.
Leapfrog effects
We do believe there will continue to be cannibalization and leapfrogging in play across the AI sphere in 2026, including less of an obsessive focus on cohorts like the Magnificent 7 (Mag7). Given that only two of its cohorts are outperforming the index so far in 2025, and our expectation of some market broadening, a monolithic approach increasingly does not make sense. Our friends at 22V Research (along with Lux Capital's Josh Wolfe) recently put together two complexes that highlight this. The "GOOG Complex" has recently become the winner relative to the "OpenAI Complex" because the latter is more levered than the former. It potentially exposes some economic risk in 2026 associated with the sustainability of capital spending plans.
Complex leapfrogs
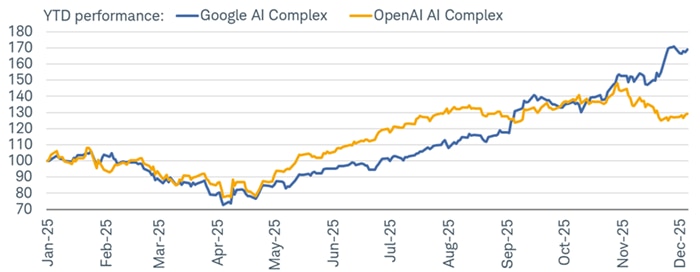
Source: Charles Schwab, Bloomberg, as of 12/5/2025.
Google AI Complex includes Alphabet, Broadcom, TTM Technologies, Celestica, and Lumentum. OpenAI AI Complex includes Nvidia, SoftBank, Oracle, AMD, Microsoft, and CoreWeave. Data indexed to 100 (base value=1/1/2025). An index number is a figure reflecting price or quantity compared with a base value. The base value always has an index number of 100. All corporate names and market data shown are for illustrative purposes only and are not a recommendation, offer to sell, or a solicitation of an offer to buy any security. Past performance is no guarantee of future results.
Participation trophy
In part due to the expectation of a widening-out in terms of the AI theme, we expect ongoing rotations in 2026, but with greater participation under the surface of the capitalization-weighted indexes. Shown below is NDR's history of the percentage of stocks outperforming the index over the rolling prior three months. Given the historically low current reading, some bounce-back is expected. This should provide a runway for improved relative performance for the combination of active vs. passive management, equal-weight vs. cap-weight, and small caps vs. mega caps. We don't expect this in linear fashion; more likely in fits-and-starts.
Historically low participation
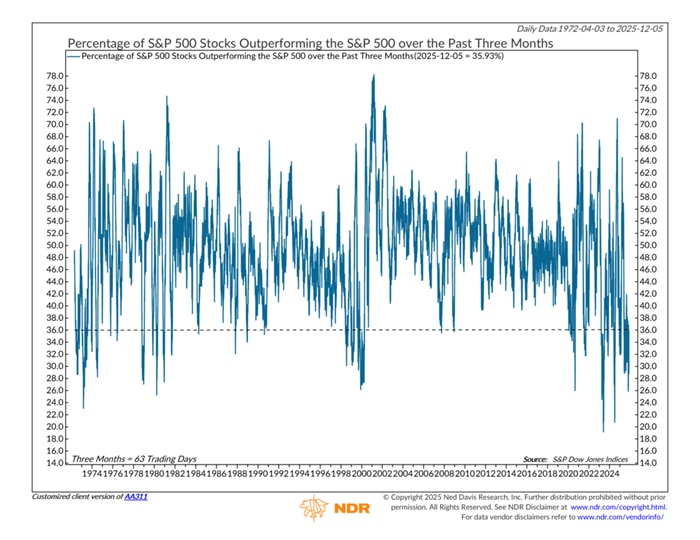
Source: Charles Schwab, ©Copyright 2025 Ned Davis Research, Inc.
Further distribution prohibited without prior permission. All Rights Reserved. See NDR Disclaimer at www.ndr.com/copyright.html, as of 12/5/2025. Dotted line represents current reading. Indexes are unmanaged, do not incur management fees, costs and expenses and cannot be invested in directly. Past performance is no guarantee of future results.
Specific to small caps, we do believe investors will continue to look for opportunities away from just the mega caps, but not all small caps are created equal. It's within this space specifically that we suggest an up-in-quality bias in terms of factor performance, with an emphasis on profitability, balance sheet strength, and reasonable valuations. This would reverse the 2025 trend given that the unprofitable cohort with the Russell 2000 is up 23% year-to-date, besting by more than double the profitable cohort's <11% gain, per Bloomberg data.
Sector swings
Sector rotations have been violent at times this year, and we expect rotations to persist alongside fickle appetites of investors. Our current sector views are favorable towards the Communication Services, Health Care, and Industrials sectors. For more details on those, and our other ratings, check out our re-launched Sector Views.
Earn it!
The consensus outlook for S&P 500 earnings at both the sector and index level are below. We did a "heatmap" version of our oft-used LSEG I/B/E/S table, thereby highlighting a largely green 2026. As shown via the bolding at the right, eight out of the S&P 500's 11 sectors have 2026 expected growth rates higher than 2025's.
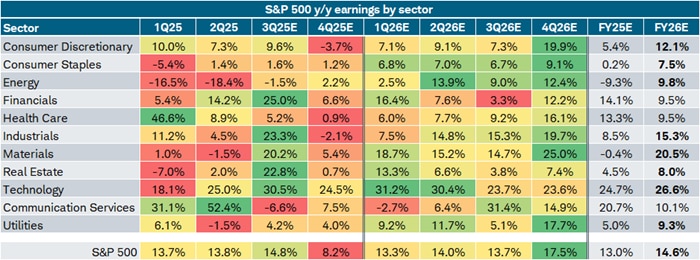
Source: Charles Schwab, LSEG I/B/E/S, as of 12/5/2025.
S&P 500 sectors shown. Sectors are based on the Global Industry Classification Standard (GICS®), an industry analysis framework developed by MSCI and S&P Dow Jones Indices to provide investors with consistent industry definitions. Forecasts contained herein are for illustrative purposes only, may be based upon proprietary research and are developed through analysis of historical public data. Color scale applied to each sector row with dark green indicating highest y/y earnings growth and dark red indicating lowest y/y earnings growth. Bolded FY26 percentages indicate higher y/y earnings growth relative to FY25. Indexes are unmanaged, do not incur management fees, costs and expenses and cannot be invested in directly. Past performance does not guarantee future results.
Amidst the AI hype and mega caps' increasingly large weight in the indexes, a less-discussed aspect of the market's performance this year has been the lack of multiple expansion in the second half of the year. As you can see in the chart below, the forward earnings per share (EPS) estimate for the S&P 500 has made successive all-time highs since the low earlier this spring. Taking a back seat has been the forward price/earnings (P/E) ratio. In other words, the E has been doing the heavy lifting, which has put downward pressure on the P/E.
In general, an earnings-driven market tends to be healthy and has been much needed this year after multiples got back to cycle (and in some cases, all-time) highs. If forward earnings estimates continue their upward trek, we see the possibility of multiples continuing to move lower heading into 2026. In other words, the market's P/E would be moving down for the so-called right reason (i.e., prices not falling rapidly). That might pave the way for some multiple expansion later in the year, especially if investors continue to have high conviction in the AI space.
Earnings to the rescue
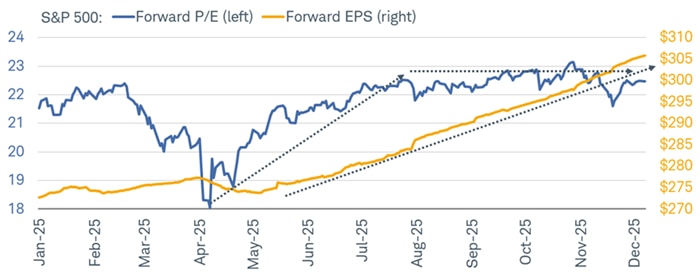
Source: Charles Schwab, Bloomberg, as of 12/5/2025.
Dotted lines for forward P/E show upward trajectory from April-August and sideways trajectory from August-December. Dotted line for forward EPS shows upward trajectory from May-December. Indexes are unmanaged, do not incur management fees, costs and expenses and cannot be invested in directly. Past performance is no guarantee of future results.
Crucially, and we make this point often (for good reason), a stretched multiple doesn't necessarily translate into imminent downside risk for the market. Shown below is one of our favorite scattergrams, which plots the S&P 500's forward P/E against the index's return a year later. You can see that the relationship is a very weak -0.12—essentially insignificant. It underscores the important market truth that valuation is a horrible market-timing tool (as if a good timing tool even exists). As a real-time example, take the S&P 500's forward P/E a year ago: a lofty 22.4. One year later, the index is up by nearly 13%.
Of course, that doesn't say anything about the incredibly volatile ride we've had over the past year, which includes a bear market for the S&P 500 on an intraday basis. Perhaps that means the better way to think about high valuations is that they make the market more vulnerable to shocks. Higher multiples are generally consistent with optimistic (and at times, euphoric) sentiment, so skittishness tends to kick in at a more aggressive pace when negative news hits the wires. Since we're in an environment of elevated multiples and sentiment—with policy risk not subsiding anytime soon—the bar for a pullback or mini correction in the beginning of 2026 is not terribly high.
Valuation says … nothing

Source: Charles Schwab, Bloomberg, 1958-11/30/2025.
Dotted line represents trendline. Correlation is a statistical measure of how two investments have historically moved in relation to each other, and ranges from -1 to +1. A correlation of 1 indicates a perfect positive correlation, while a correlation of -1 indicates a perfect negative correlation. A correlation of zero means the assets are not correlated. Indexes are unmanaged, do not incur management fees, costs and expenses and cannot be invested in directly. Past performance is no guarantee of future results.
In sum
Year-ahead outlooks are interesting exercises in that they imply a fresh turning of the page when one year ends and another begins—as if the economy and market are not dynamic beasts that don't necessarily care about the calendar. That said, what doesn't change heading into 2026 is the sticky nature of macro forces like tariffs, the K-shaped economy, and a wobbly labor market. Some themes, like AI, are still with us but they're changing in complexion. While we continue to see large numbers get larger in terms of deals and capital spending, we think there is runway for the AI adopters to continue to likely do well—allowing the market to churn higher but perhaps not at the pace it has this year.
The economy is not just influenced by shocks; its structure is absorbing and amplifying them unevenly. We aren't really waiting for clarity, we are living inside a continuously shifting equilibrium, leading to faster capital shifts between investing styles and high intra-sector dispersion. We encourage investors to embrace the reality of a higher volatility and dispersion floor. That isn't a bad environment for the market; it's just different relative to what was the norm leading up to the pandemic (and in years like 2024). We think rebalancing based on volatility, as opposed to the calendar, makes more sense, as will continuing to lean into more profitable segments of the market.

