Debt: Hard to Handle

One of our expectations highlighted in our 2023 outlook report, published in late 2022, was that the subject of the U.S. budget deficit and federal debt would increasingly become a part of the "conversation." That has certainly been the case—heightened recently, courtesy of the runup in longer-term Treasury yields. In today's report, we'll focus on the government and corporate sectors, with a focus on consumers to come in later reports.
Fiscal follies
The federal budget deficit is estimated to be about $1.7 trillion for fiscal year (through September) 2023, which is more than 6% of gross domestic product (GDP) and compares to $946 billion for fiscal year 2022. That has brought total federal debt to more than $33 trillion.
Since the start of this century, per Gavekal Research data, U.S. government debt has increased by a factor of more than 5.5, which is an annual growth rate of 7.7%. That's in contrast to GDP and debt-servicing costs, which have increased by a factor of "only" 2.7, equating to annual growth rates of 4.3% and 4.4%, respectively.
The lower rate of annual growth in debt-servicing costs was aided by the Federal Reserve's three significant monetary policy easing cycles—the latter two, starting in 2008 and 2020, saw short-term rates hit the zero-bound. Those were also cycles that included quantitative easing (QE), which helped restrain longer-term yields.
Now the Fed faces government debt that's larger than GDP, debt that needs to be financed at higher rates, and a debt service ratio growing much faster than the economy. In addition, the Fed is now reducing its holdings of Treasury securities with its quantitative tightening (QT) program; while foreign investors, U.S. banks and state/local governments are reducing their holdings.
Given that households and mutual/exchange-traded funds likely need to pick up the slack, a key question is whether yields are high enough of an incentive. Although there has been an increase in short-term inflation expectations, and economic growth has been resilient, most of the increase in yields has been the "term premium," which is the extra compensation demanded by investor to hold longer-term bonds instead of rolling over shorter-term securities.
No looking back
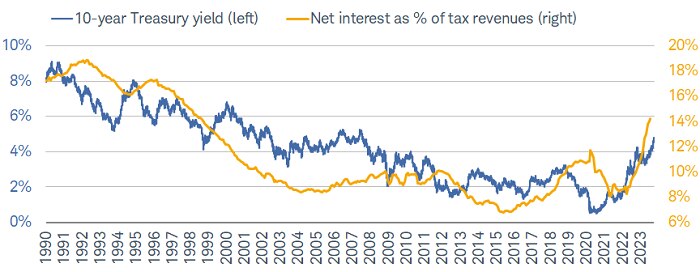
As shown in the blue line in the chart below, the 10-year Treasury yield bottomed at 0.5% in August of 2020; but it has been this year's surge from 3.3% in April to a recent high of 4.8% that has elevated the conversation. In conjunction with the Fed's aggressive monetary policy tightening cycle—underway for more than 18 months—net interest on government debt as a percentage of tax revenues, shown in the orange line below, has surged from less than 8% to 14%.
Net interest surges alongside yields

Source: Charles Schwab, Strategas Research Partners, as of 10/13/2023.
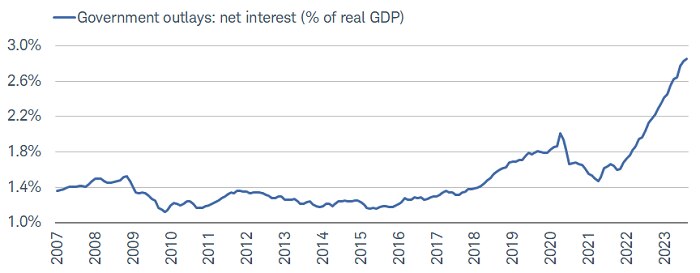
Shown another way below, net interest payments as a percentage of real GDP have gone parabolic and now exceed 2.8%; and given the growth rate, it's expected that they will soon overtake what the government spends on defense.
Net interest surging as share of GDP

Source: Charles Schwab, Bloomberg, as of 8/31/2023.
Stocks moving inversely to yields
Higher yields obviously also have implications for the corporate sector, as well as the stock market. As we detailed in our recent report about the likely end of the era of "Great Moderation," there has been a shift in the relationship between bond yields and stock prices, as shown below. For much of the Great Moderation period, which began in the late 1990s, bond yields and stock prices were positively correlated, save for short-term exceptions in 2000 and 2008.
A new correlation era?

Source: Charles Schwab, Bloomberg, as of 10/13/2023.
Correlation is a statistical measure of how two investments have historically moved in relation to each other, and ranges from -1 to +1. A correlation of 1 indicates a perfect positive correlation, while a correlation of -1 indicates a perfect negative correlation. A correlation of zero means the assets are not correlated. Indexes are unmanaged, do not incur management fees, costs and expenses and cannot be invested in directly. Past performance is no guarantee of future results.
Although the correlation is not yet back to the extremes of the three-decade period that started in the mid-1960s (which we're calling the Temperamental Era), it does suggest the landscape has changed relative to what many investors have grown accustomed to.
Corporate impact
Corporate profit concerns and higher borrowing costs are working their way into higher defaults, with both Moody's and Standard & Poor's expecting continued increases. In terms of the maturity schedule for U.S. corporations, as shown below, there is a significant acceleration coming in the next few years, both in terms of investment grade and high-yield debt.
Corporate debt maturity schedule

Source: Charles Schwab, Bloomberg, as of 10/13/2023.
Data for investment grade covers the amount outstanding of USD-denominated corporate bonds of $300 million or greater. Data for high yield covers the amount outstanding of USD-denominated bonds of $100 million or greater.
Most market and Fed watchers know that monetary policy operates with long and variable lags, and we're in the early stages of seeing that within the corporate sector. In terms of larger companies, as shown below, interest expense as a percentage of total debt for the S&P 500® had a relatively tepid increase during the first 16 months of the Fed's tightening cycle; but it began moving higher in the past couple of months.
Interest expense heading higher

Source: Charles Schwab, Strategas Research Partners, as of 9/30/2023.
It may be hard to notice the uptick in the chart above, at least relative to the loftier levels of the late 1990s. That's why the growth rate in year-over-year percentage change terms is important, too, shown below.
Change in interest expense surging

Source: Charles Schwab, Strategas Research Partners, as of 9/30/2023.
The growth in S&P 500 interest expense jumped into double-digit territory in the past two months—to +15% in August and +16% in September. It's expected that high rates of monthly growth in interest expense will persist for the next year. We will be paying close attention to what companies say about these trends during third-quarter earnings season, which has just begun.
Yields' impact on earnings
Beyond just third-quarter earnings season, the outlook for earnings longer-term will be influenced by the yield environment. Per interesting work by Strategas Research Partners, there is a direct (albeit imperfect) relationship between changes in the 10-year Treasury yield and forward two-year S&P 500 earnings growth, as shown below.
Yields' impact on forward earnings

Source: Charles Schwab, Strategas Research Partners, 1950-9/30/2023.
EPS=earnings per share. Past performance is no guarantee of future results.
Based on consensus expectations from FactSet, S&P 500 year-over-year earnings growth is expected to be about 12% in each of the next two calendar years. Looking at the chart above, large increases like that have typically only come after declines in the 10-year yield. With the latest rate of change in the 10-year yield north of +75 basis points (bps), those tranches show underwhelming earnings growth.
Implications for equity investors
There have been important shifts in stock market behavior since yields began surging in late July. The Energy sector has been strongest, both in terms of performance and breadth (the positive correlation between oil price changes and Energy sector performance is near an all-time high). A key driver to Energy's outperformance is also the sector's high and rising interest coverage ratio. Stocks with high/rising interest coverage ratios tend to have strong enough earnings growth to offset the burden of higher debt-servicing costs.
An example on the other end of the spectrum is the Utilities sector. Before the recent slight rebound, the sector had fallen to a three-year low—erasing all gains since the pandemic low in stock in 2020. The Utilities sector's interest coverage ratio is falling rather quickly and the dynamic between Energy and Utilities highlight a key reason we have encouraged investors to be focused on quality-oriented factors (characteristics), including a heightened focus on interest coverage.
In sum
We just passed the one-year "anniversary" of the S&P 500's low in October 2022; but we’ve been expressing some concerns about the market's overall health. For now, credit conditions remain relatively favorable for equities, but they're on our watch list. In the meantime, the near-total lack of participation by banks and small caps have clear ties to the rate environment and profitability/interest coverage concerns, respectively. It's why we continue to push the "stay up in quality" approach.

