Chart in a Minute
Use these market charts to support your conversations with clients about asset-allocation opportunities.
AI Investment Cycle: Navigating Dependency Risk for Clients
June 30, 2026
AI spending is serving as a macro-level stimulus supporting revenue growth, driving demand, and boosting industrial and infrastructure activity. But there are risks.
Key takeaways:
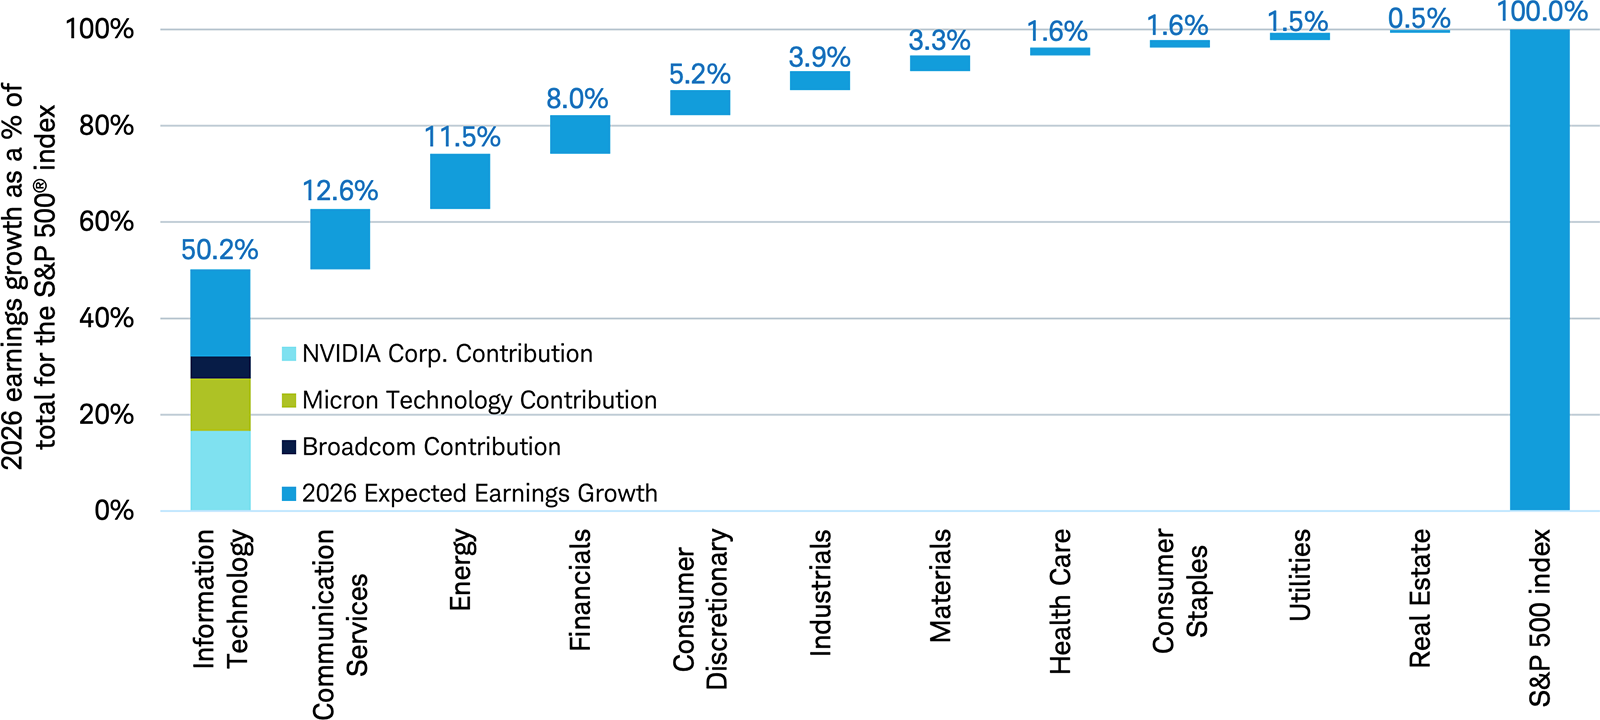
- As this chart illustrates, U.S. earnings growth has been narrowly concentrated so far in 2026. Just a small group of companies tied to AI—particularly semiconductors and digital platforms—have recently been the primary drivers of U.S. earnings.
- With stocks increasingly reliant on the AI cycle, don’t forget that if financing conditions tighten or AI-related capital spending slows, earnings expectations may downshift. If this becomes tomorrow’s reality, are your clients prepared for the potential fallout?
- If not, consider talking with them about Fundamental Index® strategies. These strategies weight firms based on measures like cash flow, dividends, and sales, breaking the link between stock price and index weight. And they can complement market cap-weighted index strategies, potentially enhancing portfolio diversification.