Upside Down(side): Markets' Wild Rides

The trade war is ongoing, notwithstanding last week's 90-day pause on some tariffs. The level, scope, and targeted countries seems to be a daily moving target, but given what we know now, it's estimated that the U.S. weighted average tariff rate is nearly 25%, the highest in more than a century, as shown below.
Hundred-year (plus) tariff storm

Source: Charles Schwab, Fitch Ratings, Census Bureau, U.S. International Trade Commission, Bloomberg Economics, as 4/11/2025.
Weighted average applied tariff is the average of effectively applied rates weighted by the product import shares corresponding to each partner country. Forecasts contained herein are for illustrative purposes only, may be based upon proprietary research and are developed through analysis of historical public data.
Amid all the tariff-related market volatility, there was a lot of chatter last week about a "Trump put" (a threshold of market weakness sufficient for the administration to adjust policy). What's been discovered is that the "put" was less about the stock market and more about the bond market. Our colleague and Chief Fixed Income Strategist Kathy Jones wrote this over the weekend:
"Underlying all of the volatility is policy uncertainty. When tariffs are on, then off, then partially on with exceptions, the market's expectations for economic growth and inflation have to adjust. Rapid changes in policy mean rapid changes in yields. Rapid changes in yields tend to catch traders—especially leveraged traders—off guard, forcing rapid re-positioning. These changes tend to spur a lot of speculation and rumors. Sorting out what's true and what isn't true is difficult."
"The most concerning thing that happened last week was the divergence between the path of the U.S. dollar and interest rates. The dollar fell sharply while yields rose sharply. That does suggest foreign selling was a factor. But it also smacks of a loss of confidence in the United States as a perceived safe haven, which isn't good for the world's reserve currency. This is the type of action you see in emerging markets when volatility hits."
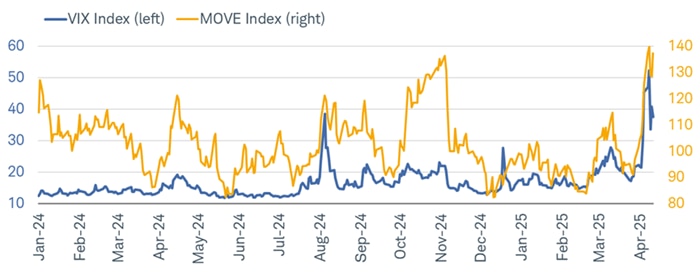
As shown below, volatility is measured in the stock market via the VIX index, while the MOVE index shows volatility in the bond market. Although both have spiked this month, bond market volatility is not yet in retreat.
MOVE over VIX
Source: Charles Schwab, Bloomberg, as of 4/11/2025.
ICE BofA MOVE Index is a yield curve weighted index of the normalized implied volatility on 1-month Treasury options. Indexes are unmanaged, do not incur management fees, costs and expenses and cannot be invested in directly. Past performance is no guarantee of future results.
Last week's strength in the equity market helped pare year-to-date returns. After suffering a near-bear market drawdown of 19%, the S&P 500 is down 9% as of Friday's close. It's been worse for other indexes and groups, like the Nasdaq and Mag7 (Lag7) group of stocks, as shown below. After a strong start to the year through February 19, bear market level declines set in (although for the S&P 500 it was only a close call).

Source: Charles Schwab, Bloomberg, as of 4/11/2025.
Magnificent 7 represents Bloomberg Magnificent 7 Index which is an equal-dollar weighted equity benchmark consisting of a fixed basket of 7 widely-traded companies (Alphabet, Amazon, Apple, Meta, Microsoft, NVIDIA, Tesla). Indexes are unmanaged, do not incur management fees, costs and expenses and cannot be invested in directly. Past performance is no guarantee of future results.
Trying to trade this rampant volatility is a tricky game, especially given that the correlation of movements within an index like the S&P 500 has gone parabolic, meaning the majority stocks within the index are generally moving in the same direction. This phenomenon makes it more difficult to separate winners from losers. As shown below, at the mid-February peak in the index, the rolling one-month correlation was near zero. As the index began to fall, the correlation started to rise (which is common), before shooting to the moon following the "Liberation Day" tariff announcement.
All together now

Source: Charles Schwab, Bloomberg, as of 4/11/2025.
Rolling 1-month correlation is calculated between the S&P 500 index and a basket of its top weight components and using historical (realized) volatilities for both the index and its components. Correlation is a statistical measure of how two investments have historically moved in relation to each other, and ranges from -1 to +1. A correlation of 1 indicates a perfect positive correlation, while a correlation of -1 indicates a perfect negative correlation. A correlation of zero means the assets are not correlated. Indexes are unmanaged, do not incur management fees, costs and expenses and cannot be invested in directly. Past performance is no guarantee of future results.
Most notable last week was last Wednesday's epic surge in stocks, which helped to calm investors' nerves. The 9.5% single-day jump in the S&P 500 was the third-largest in the post-WWII era. We highlight in the table below, that among the list of all daily moves of at least +5%, more of them occurred within bear markets (14) than in bull markets (10). Per the bull market big up days, notice that some of the largest daily gains in stocks came somewhat immediately following bear market lows and/or major corrections (2022, 2020, 2009, 1997/98, and 1970).

Source: Charles Schwab, Bloomberg, as of 4/11/2025.
Bull and Bear markets classified as +/-20% changes in S&P 500. Indexes are unmanaged, do not incur management fees, costs and expenses and cannot be invested in directly. Past performance is no guarantee of future results.
Bad breadth
The recent rout in stocks has led to a significant washout in market breadth, with major indexes seeing the percentage of their members trading above their 50-day moving averages sink quickly. As shown in the chart below, that metric for the S&P 500, Nasdaq, and Russell 2000 fell into single-digit territory at the worst point of the current drawdown. The drop for the S&P 500 was much more severe, underscoring investors' willingness to shed even their high-quality holdings as the global trade war unfolded.
Short-term breadth reprieve

Source: Charles Schwab, Bloomberg, as of 4/11/2025.
Indexes are unmanaged, do not incur management fees, costs and expenses and cannot be invested in directly. Past performance is no guarantee of future results.
The upside is that, like with investor sentiment, once breadth gets this weak, it indicates a "reset" of sorts—allowing stocks to regain their footing (see the end of 2024 as an example). The downside is that a clear catalyst is needed to jolt stocks into recovery mode. To be sure, some catalysts—like the 90-day pause for aggressive reciprocal tariffs and the exemption of smartphones and laptops—have started to pop up, but they aren't necessarily doing a lot of work to eliminate the thick cloud of uncertainty that still hangs over the market.
That is emphasized via sector leadership. As shown in the chart below, traditional defensives like Consumer Staples, Utilities, and Health Care have fared well when it comes to the share of members trading above their 50-day moving average. Even more of a standout is Utilities' share of members trading above their 200-day moving average (at nearly two thirds).
Defensive sectors' breadth healthiest

Source: Charles Schwab, Bloomberg, as of 4/11/2025.
S&P 500 sectors shown. Indexes are unmanaged, do not incur management fees, costs and expenses and cannot be invested in directly. Past performance is no guarantee of future results.
The resilience in defensives' breadth has been consistent with their outperformance since the S&P 500's all-time high back in mid-February. As shown in the table below, Consumer Staples, Utilities, and Health Care are at the top of the leaderboard—respectively—since the market's peak. At the opposite end is the "growth trio" of Information Technology (Tech), Consumer Discretionary, and Communication Services; all of which suffered bear-market level declines during the "crush" period between February 19 and April 8.

Source: Charles Schwab, Bloomberg, as of 4/11/2025.
Indexes are unmanaged, do not incur management fees, costs and expenses and cannot be invested in directly. Past performance is no guarantee of future results.
Anatomy of a rebound
Breadth statistics make it clear that indexes are at or near washout status, but in order for a durable rebound to take shape, defensive leadership likely needs to take a breather—or rather, traditional cyclicals (like Financials, Industrials, and Materials) need to reclaim some lost footing. We think that would send a positive signal that the market is regaining some confidence after being hit hard from tariff volatility, but we also think this continues to be a low-conviction environment.
Trying to gauge sector moves and leadership shifts is nearly impossible right now, especially as the rules of the U.S. tariff and trade game seem to change on almost a daily basis. Given that, we have neutralized our sector ratings, bringing all 11 S&P 500 sectors to "market perform" (neutral). The last time we implemented this kind of change was during the depths of the pandemic. While we are in a confidence crisis, not a health (or financial) crisis, the degree of volatility we're seeing—be it in the VIX, MOVE or Economic Policy Uncertainty Index—rivals what we saw in 2020.
Factors at play
We continue to emphasize that investors should continue to take a factor-based approach as a way to navigate volatility within the equity market. Screening for high-quality companies or industries is one of the best ways to play defense these days. Low volatility, low beta, high interest coverage, and stable profit margins are among the characteristics that have fared well in this recent bout of turbulence. While those factors might underperform when tariff relief/delay news hits the newswires and gives a lift to markets, those high-quality factors should remain outperformers when the opposite occurs.
The reality is that this current environment is being dominated by man-made supply shocks unlike anything seen in the past century. However, it's crucial to avoid making assumptions (economic or market) based on recent trends. Although the current policy landscape and related economic uncertainty more than justify the recent spike in volatility, be mindful of not interpreting short-term market moves as anything resembling clear signals of where we go from here either in the economy or markets. Many of these extreme moves are simply the result of technical break points (in both directions) associated with a wide variety of stressed positions and their unwinds.
About the authors

Liz Ann Sonders
