How to evaluate ETFs

Introduction
With more than 3,000 exchange-traded funds (ETFs) on the market, choosing the right funds for your portfolio can be a challenge. That’s why having a consistent evaluation approach across all product structures and asset categories is helpful. Following this three-step framework can help you choose the best ETFs based on your investment objectives.
Steps to ETF selection
- Exposure
- Holding costs
- Trading costs
While each component is important, finding the right exposure for your portfolio should carry the most weight. Fund holding and trading costs can lead to differences in hundreds of basis points, but exposure could represent the difference in thousands of basis points in returns.
1. Exposure:
How well does the ETF cover your desired objectives?
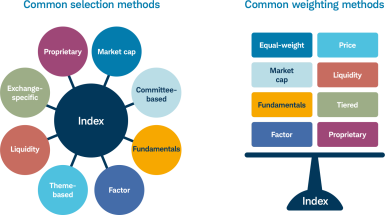
The first and arguably the most important step in selecting an ETF is to analyze the exposure the fund is delivering. It’s important to look beyond the fund name and category classification because even ETFs targeting the same market segment can have distinctly different exposures. Since most ETFs are passive and seek to track an index, a good starting point is to understand an ETF’s underlying index and how it selects and weights its constituents.
Selection and weighting methods can lead to profound differences in index exposures. For example, consider two indexes with the same selection method (hold the same constituents) but different weighting schemes—one equally weighted and one cap-weighted. The equally weighted index will have different sector weightings and a low-size tilt compared with the cap-weighted index, in which companies with the largest market capitalization get the largest weightings.
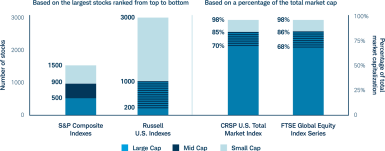
Defining large, mid and small-cap breakpoints between major index providers
Source: Provider index methodology, as of June 30, 2024. Indexes are unmanaged, do not incur management fees, costs and expenses, and cannot be invested in directly.
It’s also important to understand the index provider’s classifications of market size, style, and countries. What are the index provider’s market-size breakpoints? For example, does the index provider classify mid-cap as a specific number of stocks within a range, or is mid-cap based on a percentage range of the total market cap of a broad market index?
To better understand an ETF’s exposure, pick a well-known cap-weighted index in the same category as a benchmark and compare the ETF’s exposures with that index in terms of holdings, size, sector, country and factor tilts. Even if you are looking for a non-market cap-weighted strategy, such as a strategic beta, it’s still helpful to know the differences in fund exposure compared with a broad cap-weighted index. This practice can be particularly useful with actively managed ETFs, which are gaining traction lately with the recent approval of semi-transparent (also known as non-transparent) ETFs. An active semi-transparent ETF does not publicly disclose its entire portfolio composition each business day, which may affect the price at which shares of the ETF trade in the secondary market.
Additional exposure considerations
- Whether the index only includes stocks from a specific exchange (e.g., Nasdaq).
- The index provider’s country classification framework (e.g., MSCI considers Korea an emerging market, whereas FTSE Russell classifies Korea as a developed market).
- The duration range of a fixed income index (e.g., “intermediate-term” can mean 1-10, 3-7, 3-10, 5-10, or 7-10 years depending on the index).
- The distinction between developed ex-U.S. and global ex-U.S. (e.g., global ex-U.S. includes both developed and emerging markets outside the United States).
- For commodity funds, whether the fund gets its exposure from futures contracts or from holding the physical commodity itself (e.g., oil funds versus gold funds).
- For theme-based ETFs, how themes are defined and how stocks are weighted (e.g., how a “water company” is defined; how the index weights water-specific companies versus utilities).
2. Holding costs:
What will it cost to hold the ETF long-term?
The largest cost to holding an ETF often comes from the fund’s operating expense ratio (OER).1 However, we believe too many investors assume that an ETF’s OER is the only cost.
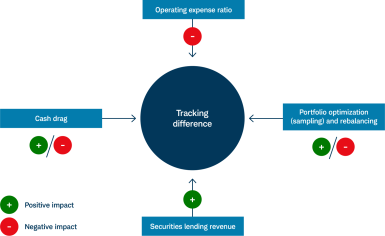
For index-tracking ETFs, a better gauge of overall holding cost is the total tracking difference of the fund’s net asset value (NAV) versus the index, or how well the fund tracks its underlying index. Several components go into tracking difference, with OER usually being the largest—but not the only—factor that might cause a fund to underperform its index.
Other factors, such as whether the ETF uses a sampling strategy (versus a replication strategy) and cash drag, can generate positive or negative returns for a fund.2 Meanwhile, securities lending may generate income for a fund, contributing to a positive effect on tracking difference, and therefore fund performance.
Elements that affect tracking
Let’s take a look at two hypothetical ETFs: A and B.
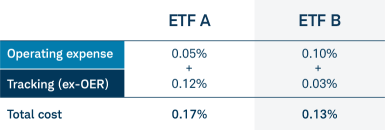
ETF A has a 0.05% OER, while ETF B has a 0.10% OER. Each ETF tracks the same index, but the two ETFs differ significantly in tracking their underlying indexes due to differences in portfolio management style (sampling versus replication) and securities lending.
OER isn't the whole story
If an investor looked only at the operating expense ratio, ETF A would seem less costly. However, after incorporating other factors such as sampling, cash drag and securities lending, ETF B did a better overall job of tracking the index.
After including OERs and tracking, ETF B was the more cost-efficient fund. It cost the investor 0.13%, whereas the “cheaper” ETF A had a total cost of 0.17%.
Additional costs to watch for
In addition to OERs and other causes of tracking difference, consider a few other possible costs when evaluating ETFs.
- Capital gains distributions. Look at the fund’s historical capital gains distributions, because capital gains tax is a cost to the investor.
- Tax status of historical distributions. Dividend distributions can be classified as qualified or non-qualified, and the two classifications are taxed at different rates.3
- For leveraged funds, any negative compounding effects of the daily rebalance.
- For funds holding futures contracts, any impacts of contango.4
- For currency-hedged ETFs, any negative embedded yields5 in the underlying currency being hedged.
3. Trading costs:
How cost-efficiently can I trade the ETF?
Unlike mutual funds, ETFs aren’t bought and sold at NAV but rather traded on an exchange at a market price. Like a stock, ETFs come with bid/ask spreads.6
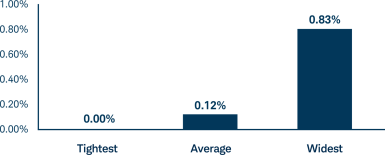
For example, in all ETFs classified as U.S. large-cap by ETF.com, average bid/ask spreads ranged from 0.00% to 0.79%, or $0.01 to $0.24, as of June 30, 2023. Expenses from getting into and out of an ETF position can stack up if the ETF is trading at wide bid/ask spreads.
U.S. Fund Large Blend ETF range of bid/ask spreads
Source: Morningstar Direct, as of 10/4/2024. Reflects market-cap index weighted ETFs only.
Another factor to consider when evaluating cost-efficiency is an ETF’s liquidity profile. ETF liquidity comes in two levels, primary and secondary,7 and is not necessarily defined by average daily trading volume. For most investors trading hundreds of shares, secondary liquidity, or the trading of ETF shares on the exchange, is typically the focus. This is where using a limit order can be important for ETFs trading at wide bid/ask spreads.
But unlike a stock, ETFs have another layer of liquidity. Primary, or block, liquidity represents the liquidity of the underlying securities of the portfolio. For investors looking to trade in large size, or in “blocks,” ETFs with strong primary liquidity can still possibly be traded efficiently through a liquidity provider, even if they barely trade on the exchange and have a wide bid/ask spread.8
In other words, liquidity in the primary market may, at times, be more critical than the liquidity of the ETF on the secondary market.
Investors should also understand any impediments to creation and redemption of ETF shares. For example, if creations of new shares are halted for an ETF, increased demand in those shares may cause the fund to trade at a premium, or above its NAV.
Assets under management and average daily trading volume may be good initial indicators of trading costs, but investors may want to consider looking at other characteristics such as bid/ask spreads, primary liquidity and premium/discounts to NAV.
Summary
There are many ways to analyze and evaluate ETFs but, with more than 3,000 products now available in the United States, it’s important to have a consistent approach that works across all products and asset classes. Following these three steps can help simplify and clarify the evaluation process. When choosing an ETF, remember that not all ETFs are created equal. It’s imperative to look beyond the fund name and operating expense ratio to understand an ETF’s true exposure, holding costs, and overall trading costs.
Explore more ETF insights
Discover ETF Know:How
Browse our full-spectrum curriculum of ETF tools and resources designed to help you boost your knowledge and gain a competitive advantage.
Your guide to evaluating strategic beta ETFs
Know what questions to ask as you navigate the complexities of factor-based and other strategic beta strategies.
Explore Schwab ETFs
Help your clients get exceptional value from their investments with the product finder.
