2026 Outlook: Corporate Credit

Key takeaways
- We are maintaining our "up-in-quality" theme given low credit spreads. Investment-grade corporate bonds still appear attractive, however, as their yields are generally near the upper end of their 15-year range.
- High-yield bonds and bank loans can be considered in moderation, but rich valuations make us a bit cautious. We prefer high-yield bonds over bank loans for investors willing to take extra risks.
- Preferred security prices have declined lately, making the entry point for long-term investors a bit more attractive. They can make sense for investors in high tax brackets given their potential tax advantages.
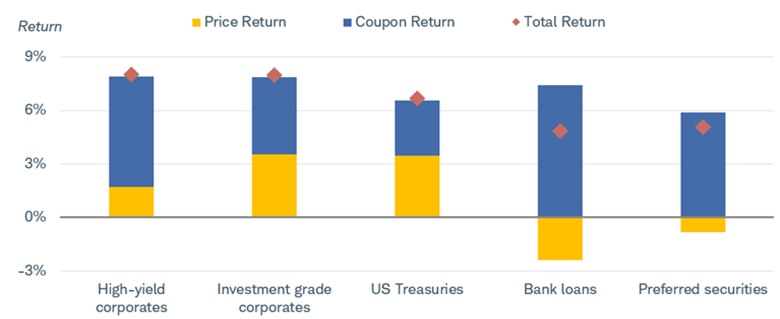
It has been a good year for most corporate bond investments. Rate cuts by the Federal Reserve helped pull up the prices of Treasuries and other high-quality bond investments, as bond prices and yields generally move in opposite directions. Credit concerns have weighed on the prices of some of the riskier bond investments like high-yield bonds, bank loans, and preferred securities, however. For most corporate bond investments, income payments have generally been the key drivers of returns, and those income payments have helped the riskier bond investments still deliver positive returns year-to-date, helping to offset some of the price declines.
Coupon payments have been the key driver of returns for most corporate bond investments this year
Source: Bloomberg, as of 11/28/2025.
Indexes representing the investment types are: High-yield corporates = Bloomberg US Corporate High Yield Index; Investment grade corporates = Bloomberg Investment Grade Corporate Index; US Treasuries = Bloomberg US Aggregate Treasury Index; Bank loans = Bloomberg US Leveraged Loan Index; Preferred securities = ICE BofA Rate Preferred Securities Index. Indexes are unmanaged, do not incur management fees, costs, and expenses, and cannot be invested in directly. Past performance is no guarantee of future results.
We expect a similar theme in 2026, with income payments likely being the key driver of total returns. Default risk should weigh on the high-yield bond and bank loan markets, however, and price gains for both investments may be tough to achieve over the course of the next 12 months.
Total returns are important considerations for investors, but we think the actual yields matter more. Over time, bond prices can rise and fall in the secondary market, but barring default, they should mature at their par value. The income earned tends to be the key driver of returns when held for longer investing periods.
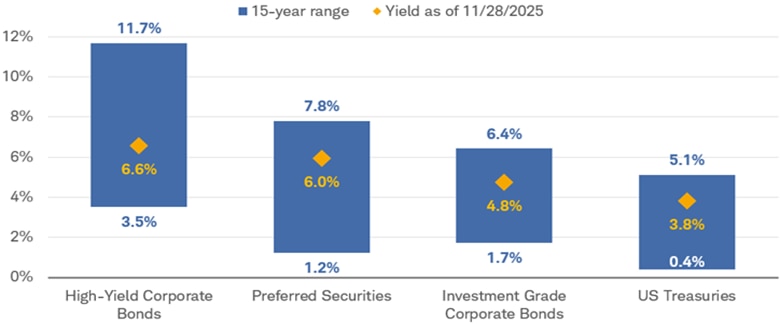
Yields for higher-rated investments still appear attractive today. The average yield of the Bloomberg US Corporate Bond Index is below 5%, after hitting a peak of 6.4% in late 2023, but is still near the high end of its 15-year range. It's also well above its 15-year average of 3.6%.
High-yield bond yields don't appear as attractive when viewing them through that 15-year lens. The average yield of the Bloomberg US Corporate High-Yield Bond Index is well below its 15-year peak, and its average yield of 6.6% at the end of November 2025 is now below its 15-year average.
In short, investment-grade corporate bonds and preferred securities still offer average yields near the upper end of their 15-year range, but high-yield bond yields are below their 15-year averages. Given that trend, we still suggest investors generally favor an up-in-quality approach to corporate bond investing.
Investment-grade corporate bond yields are still at the high end of their 15-year range, but high-yield bond yields aren't
Source: Bloomberg, as of 11/28/2025. The 15-year range is from 11/28/2010 through 11/28/2025.
Indexes representing the investment types are: High-Yield Corporate Bonds = Bloomberg US Corporate High Yield Index; Preferred Securities = ICE BofA Rate Preferred Securities Index; Investment Grade Corporate Bonds = Bloomberg Investment Grade Corporate Index; US Treasuries = Bloomberg US Aggregate Treasury Index. Indexes are unmanaged, do not incur management fees, costs and expenses, and cannot be invested in directly. Past performance is no guarantee of future results.
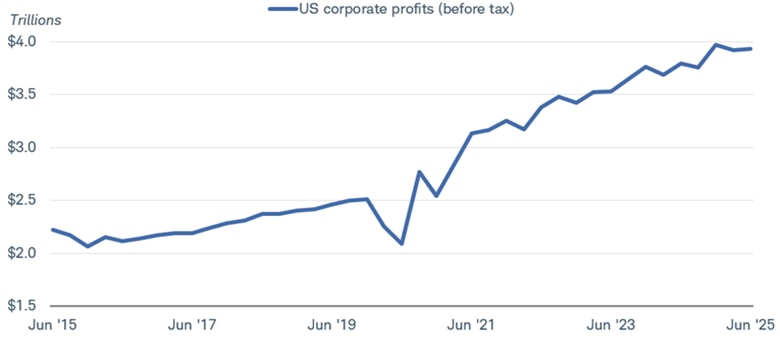
Corporate fundamentals remain relatively healthy. In aggregate, corporate balance sheets are sound, with plenty of liquid assets relative to their short-term liabilities. Corporate profits, using data from the Bureau of Economic Analysis, are still near their all-time highs. Although corporate profits have been relatively flat for the last three quarters, hovering near $3.9 trillion, the high level is what matters more for bond investors.
Corporate profits remain near their all-time highs
Source: Bloomberg, using quarterly data from 2Q 2015 through 2Q 2025.
US Corporate Profits with IVA and CCA Total Index (CPFTTOT Index). Indexes are unmanaged, do not incur management fees, costs and expenses, and cannot be invested in directly. Past performance is no guarantee of future results.
There are some cracks forming, however. A few corporate bankruptcies have made headlines lately, but the corporate default rate had been somewhat elevated since late 2023 with little fanfare. Those defaults had generally flown under the radar as a large number of them were "distressed exchanges." A distressed exchange occurs when a struggling issuer renegotiates its debts with its lenders, perhaps in the form of a principal haircut or maturity extension. Rising corporate bond supply, specifically from technology companies as they build out their artificial intelligence capabilities, poses a risk to corporate bond prices if demand doesn't keep up with supply.
Although we're maintaining our up-in-quality theme, investors can still consider riskier investments like high-yield bonds and bank loans in moderation, in our view. The cracks listed above might mean more volatility and the potential for price declines compared to their higher-rated counterparts.
Below we'll go over key considerations for various taxable credit investments.
Investment-grade corporate bonds
- The credit quality of the investment-grade corporate bond market has been improving lately.
- Average yields are still high compared to the years leading up to the pandemic, and the investment-grade corporate bond yield curves is currently positively sloped, meaning investors are rewarded with higher yields by considering intermediate- and long-term bonds.
Investment-grade corporate bonds remain attractive given their improving credit quality and high yields they currently offer.
Yields have come down a bit over the past few years as the Fed pivoted from aggressive rate hikes to a gradual pace of rate cuts, but they're still at levels well above what was available in the years following the 2008-2009 global financial crisis through early 2022. The average yield-to-worst (the lowest yield an investor can receive from a callable bond, barring default) of the Bloomberg US Corporate Bond Index was 4.8% at the end of November, compared to its average of just 3.2% from 2010 through 2021.
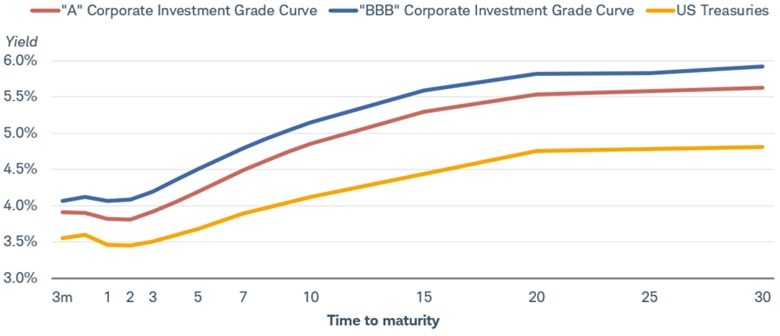
The slope of the yield curve is also compelling, as investors are generally rewarded with higher yields by considering intermediate- and long-term securities than they are with Treasuries. With the Fed likely to cut rates gradually from here, reinvestment risk—the risk that the proceeds from an investment, like interest payments or maturing bonds, will have to be reinvested at a lower yield—is still present. With investment-grade corporates, investors currently can still earn yields in the 4.25% to 5.25% area when considering maturities of five to 10 years.
The investment-grade corporate bond yield curves are more positively sloped than the Treasury curve
Source: Bloomberg, as of 11/28/2025.
US Treasury Actives Curve, USD US Corporate A+, A, A- BVAL Yield Curve, and USD US Corporate BBB+, BBB, BBB- BVAL Yield Curve. Past performance is no guarantee of future results. For illustrative purposes only. See disclosures for more information.
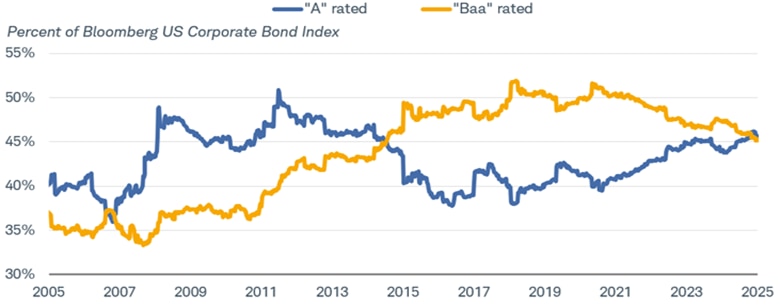
Investment-grade corporate bond credit quality has been improving as well. Beginning in July 2008, the share of Baa rated1 bonds made up a rising share of the Bloomberg US Corporate Bond Index, increasing from 33% all the way to 52% in January 2019. Since then, that share has trended lower, albeit with some hiccups along the way. At the end of November, Baa rated issuers made up 45% of the index, and A rated issuers surpassed them as the largest share of the index at 46%.
"A" rated bonds now make up the largest share of the Bloomberg US Corporate Bond Index
Source: Bloomberg, using weekly data from 11/28/2005 through 11/21/2028.
Lines represent the amount outstanding of the A and Baa subsets of the Bloomberg US Corporate Bond Index as a percent of that overall index.
Credit spreads remain low, posing a risk to the potential short-term performance of investment-grade corporate bonds. Credit spreads are the extra yields that corporate bonds offer above comparable Treasuries.
If spreads rise, due to a deteriorating economic outlook or weakening corporate fundamentals, to name a few drivers of spreads, corporate bond prices would fall relative to Treasuries. The potential price declines would likely be low given the improving fundamentals of the investment-grade corporate bond market, as the chart above highlights.
Investment-grade corporate bonds tend to make the most sense in tax-advantaged accounts as their income payments are fully taxable. While the currently low spreads may result in underperformance relative to Treasuries in 2026, the high yields they currently offer still make them attractive for investors with longer investing horizons. Investment-grade corporate bonds generally have low default rates, so over time their returns tend to be higher than Treasuries.
High-yield bonds and bank loans
- We suggest investors only consider high-yield bonds or bank loans in moderation, as corporate defaults and bankruptcies may weigh on their prices.
- The outlook for high-yield bonds is more positive than bank loans given their higher average credit ratings and fixed coupon rates.
High-yield bonds and bank loans can be considered in moderation, but cracks in the credit markets suggest their prices likely have more downside than their investment-grade counterparts of the next 12 months. We suggest a cautious approach when considering riskier investments, and we generally prefer high-yield bonds over bank loans given their higher credit ratings and potential for more stable income payments.
High-yield bonds and bank loans both carry sub-investment-grade credit ratings, but they have a few key differences. While high-yield bonds generally have fixed coupon rates, bank loans have floating coupon rates. Their coupon rates are usually based on a short-term benchmark, like the Secured Overnight Financing Rate (SOFR) plus a spread. The spread is meant to compensate for their higher risks, like the risk of default. Bank loans rank senior to traditional high-yield bonds, and are generally secured by a pledge of the issuer's collateral. They can still default, however.
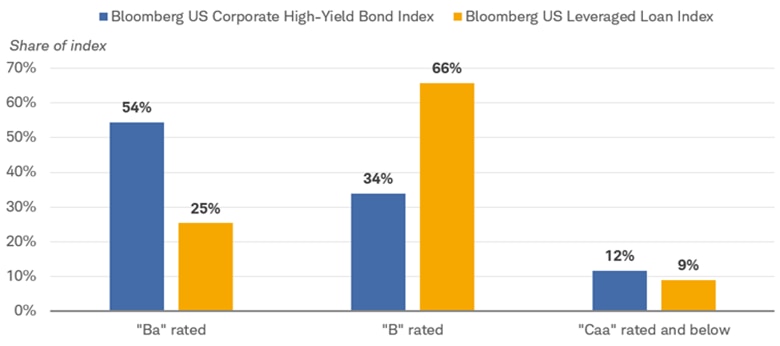
One reason we prefer high-yield bonds to bank loans is their credit quality. Not all "junk" bonds are created equal, and the makeup of the Bloomberg US Corporate High-Yield Bond Index is tilted toward issues with ratings at the upper end of the ratings scale. More than half of the high-yield index is comprised of issues with ratings of Ba, while B rated issues make up nearly two-thirds of the Bloomberg US Leveraged Loan Index.
Ba rated issues make up most of the high-yield bond index, but the leveraged loan index is mostly comprised of issues rated B or lower
Source: Bloomberg.
Bloomberg US Corporate High-Yield Bond Index and Bloomberg US Leveraged Loan Index. Data as of 11/28/2025.
So far in 2025, average bank loan prices have declined, compared to modest price increases for high-yield bonds, as the chart at the top of this commentary highlights. If defaults remain elevated—like they have lately—there may be more risk of widespread default for the bank loan market given their lower credit ratings relative to the high-yield bond market.
The income payments made by bank loans (or funds that hold bank loans) should decline as the Fed gradually cuts its benchmark interest rate, since their coupon payments adjust based on short-term interest rates. Compared to high-yield bonds, bank loans should therefore have a lower income return in 2026, with the potential for falling prices given their lower ratings.
Low credit spreads are a key reason behind our cautious view of high-yield bonds. The average option-adjusted spread of the Bloomberg US Corporate High-Yield Bond Index closed November at just 2.7%, well below its 20-year average of 4.9%.
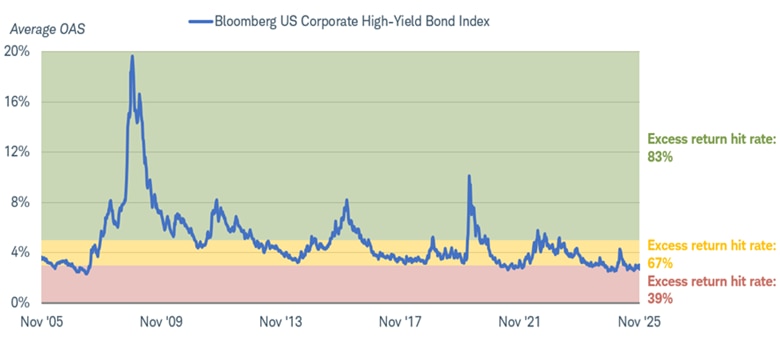
Low spreads mean that investors aren't compensated too well for taking risks, but they also make the potential for outperformance relative to Treasuries less likely. The chart below highlights how often the Bloomberg US Corporate High-Yield Bond Index has outperformed U.S. Treasuries (or had "excess returns") over 12-month periods since 2005, depending on where the starting spread was. When the average spread was 3% or less (the red shaded area below), high-yield bonds only outperformed Treasuries 39% of the time. When spreads were 5% or more (the green shaded area below), high-yield bonds outperformed Treasuries 83% of the time.
When spreads are 3% or less, outperformance has been relatively rare
Source: Bloomberg, using daily data from 11/28/2005 to 11/28/2025.
Option-adjusted spreads (OAS) are quoted as a fixed spread, or differential, over U.S. Treasury issues. Shaded areas represent spread ranges of 0% to 3%, 3% to 5%, and 5% or more, and the "excess return hit rate" represents the percent of time that the index has generated a positive 12-month excess return given the starting spread. Schwab does not recommend the use of technical analysis as a sole means of investment research. Past performance is no guarantee of future results.
Investors can still consider high-yield bonds, and to a lesser extent, bank loans, in moderation, but low spreads and recent default trends make the short-term outlook a bit challenging.
Preferred securities
- Preferred security yields have risen a bit lately (as their prices declined) making the entry point potentially more attractive for long-term investors. Volatility may continue, however.
- Many preferreds pay dividends that are taxed at lower rates than ordinary income payments, offering benefits for investors considering them in taxable accounts.
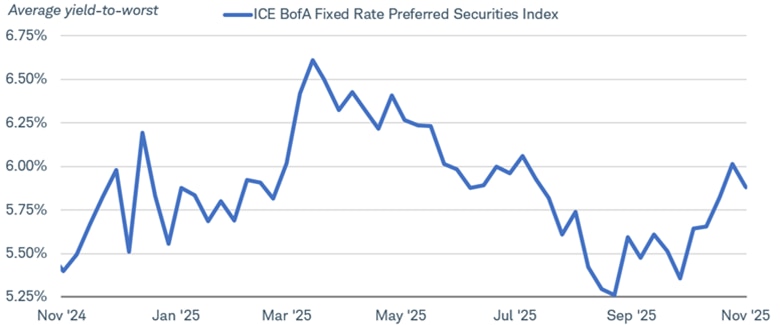
Preferred security performance generally lagged other taxable credit investments in 2025 year to date, but total returns have been positive as high income payments helped offset modest price declines. Preferred securities are hybrid investments that share characteristics of both stocks and bonds. Their yields, and therefore prices, tend to follow the trend of long-term Treasury yields, but that relationship has broken down a bit lately. While the 10-year Treasury yield ended November near its 2025 low, preferred security yields have risen by more than 50 basis points (or 0.50%) since mid-September.
Average preferred security yields are up more than half of a percentage point since September
Source: Bloomberg, using weekly data from 11/28/2024 through 11/28/2025.
ICE BofA Fixed Rate Preferred Securities Index (P0P1 Index). Indexes are unmanaged, do not incur management fees, costs, and expenses, and cannot be invested in directly. Past performance is no guarantee of future results.
Credit concerns at banks could be the culprit for higher yields (and lower prices). A few regional banks highlighted that some loans had soured in the third quarter, while a recent report from the New York Federal Reserve highlighted that consumer loan applications were being rejected at high rates. If consumers and businesses become more delinquent, that can weigh on bank earnings and their balance sheets.
On the bright side, preferreds generally have high credit ratings—usually investment-grade or the top level of the high-yield spectrum. If the economy slows or if loan defaults did pick up, highly rated and well capitalized banks should be able to weather that storm.
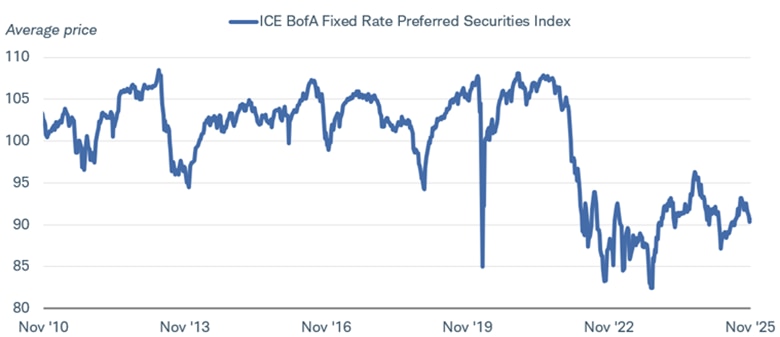
The increase in yields lately has pulled preferred prices down, and the entry point appears relatively attractive for long-term investors. But that attractive entry point still comes with risks: The average price of the index fell 3% from mid-September through mid-November, and it's down more than 6% from the September 2024 high.
Preferred security prices are relatively low
Source: Bloomberg, using weekly data from 11/28/2010 through 11/28/2025.
ICE BofA Fixed Rate Preferred Securities Index (P0P1 Index). Indexes are unmanaged, do not incur management fees, costs and expenses, and cannot be invested in directly. Past performance is no guarantee of future results.
Understanding those risks is key to preferred security investing. Given that they have long maturities, or no maturities at all, preferreds should be considered long-term investments. To earn the higher yields they offer, investors should be prepared to ride out the ups and downs.
Preferred securities can also offer tax advantages and can make sense for investors in high tax brackets who are considering them for taxable accounts. Many preferred stocks pay qualified dividends that are subject to lower tax rates than traditional interest income. Investors considering preferreds relative to other investments should always consider what type of account they'll be held in—taxable or tax-advantaged—and if held in taxable accounts, the after-tax yield. Not all preferred stocks or securities pay qualified dividends—some pay interest—so it's important to know what you own and what the tax consequences are. Qualified dividends are generally taxed at 0%, 15% or 20% rates, depending on income limits.
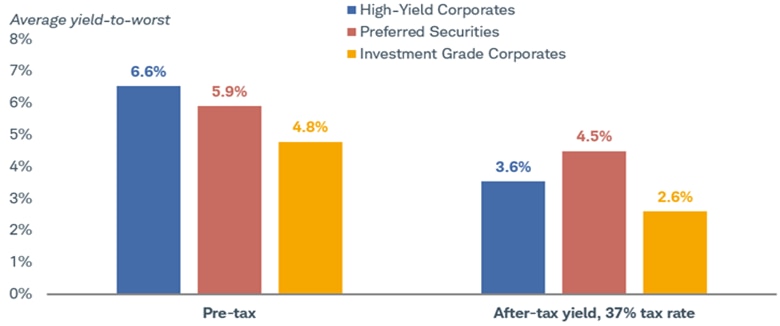
Those lower rates can be an advantage for investors in high tax brackets because the income payments from most taxable bond investments are taxed at ordinary income tax rates. On an after-tax basis, preferreds that pay qualified dividends can offer higher yields than high-yield bonds, but generally with higher credit ratings.
Preferred securities can offer potential tax advantages
Source: Bloomberg, as of 11/28/2025.
Indexes representing the investment types are: High-Yield Corporates = Bloomberg US Corporate High-Yield Bond Index; Preferred Securities = ICE BofA Fixed Rate Preferred Securities Index; and Investment Grade Corporates = the Bloomberg US Corporate Bond Index. The "after-tax" column makes the following assumptions: Investment-grade corporate and high-yield corporates include a 37% federal tax, a 5% state tax, and the 3.8% Net Investment Income Tax (NIIT); Preferred securities assume a 20% qualified dividend tax and the 3.8% NIIT. Indexes are unmanaged, do not incur management fees, costs and expenses, and cannot be invested in directly. Past performance is no guarantee of future results.
We continue to suggest an up-in-quality fixed income bias for the short run, but investors can still consider some of the riskier parts of the fixed income market in moderation.
For now, we prefer high-quality investment-grade corporate bonds given their balance of low-to-modest credit risk. Even with corporate defaults and bankruptcies making headlines, investment-grade issuers should be able to weather that environment better than issuers with lower ratings. Bond investors willing to take a little more risk can consider preferred securities, as today's low prices make the entry point for long-term, income-oriented investors more attractive. Their potential tax benefits make them even more attractive for investors in higher tax brackets who are holding them in taxable accounts.
High-yield bond spreads are low and we'd prefer to see them rise a bit more before we take a more positive view. They can be considered in moderation, but we'd rather see spreads near in the 4.5% to 5% area or higher before we'd suggest investors tactically add them to portfolios.
1 The Moody's investment-grade rating scale is Aaa, Aa, A, and Baa, and the sub-investment-grade scale is Ba, B, Caa, Ca, and C. Standard and Poor's investment-grade rating scale is AAA, AA, A, and BBB and the sub-investment-grade scale is BB, B, CCC, CC, and C. Ratings from AA to CCC may be modified by the addition of a plus (+) or minus (-) sign to show relative standing within the major rating categories. Fitch's investment-grade rating scale is AAA, AA, A, and BBB and the sub-investment-grade scale is BB, B, CCC, CC, and C.
