Fixed Income: Taking Risk in Moderation

"Up in quality" has been a theme of ours for over a year, as we have suggested investors focus on highly rated "core bonds" like U.S. Treasuries, investment grade-rated corporate bonds or municipal bonds. We continue to maintain that guidance, and the rationale is twofold:
- the yields that highly rated investments currently offer are still at the high end of their 15-year ranges, meaning investors don't need to take too much risk to earn high yields today;
- the extra yield that riskier investments currently offer above highly rated investments is very low, meaning investors aren't compensated very well to take additional risks.
This doesn't mean investors should avoid lower-rated, riskier investments like high-yield corporate bonds, bank loans, or preferred securities altogether, mainly because their yields are currently high, as well.
Bond yields can vary depending on risk

Source: Bloomberg, as of 2/21/2025.
Indexes representing the investment types are: Bank Loans = Morningstar LSTA Leveraged Loan 100 Index; High-Yield Corporates = Bloomberg U.S. Corporate High-Yield Bond Index; Preferred Securities = ICE BofA Fixed Rate Preferred Securities Index; Investment Grade Corporates = Bloomberg U.S. Corporate Bond Index; Treasuries = Bloomberg U.S. Treasury Index; Municipal Bonds = U.S. Municipal Bond Index. Indexes are unmanaged, do not incur management fees, costs and expenses, and cannot be invested in directly. Diversification strategies do not ensure a profit and do not protect against losses in declining markets. Past performance is no guarantee of future results.
Rather, those investors interested in the higher yields should be prepared for volatility and potential price declines over the short run. When held for longer periods—think two years or more—they can make sense for investors who can stomach the potential ups and downs.
We recently discussed our outlook on preferred securities, so below we'll discuss what investors need to know when considering high-yield bonds and banks loans.
High-yield corporate bonds
Our short-term cautious view is driven by low credit spreads, or the extra yields that non-Treasury securities offer above Treasuries with comparable maturities. That extra yield (spread) is meant to compensate investors for the heightened risks, like the risk of default.
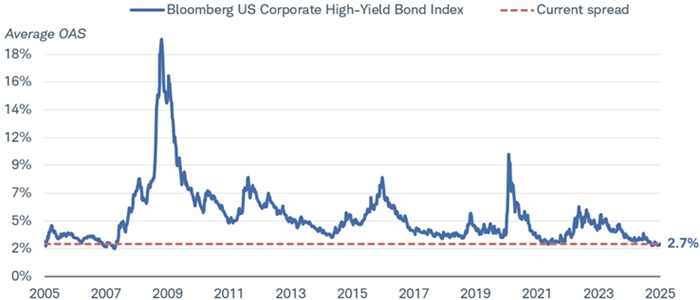
The average option-adjusted spread of the Bloomberg US Corporate High-Yield Bond Index is near its all-time low reached in May 2007. A spread of just 2.7% (or 270 basis points) means that high-yield bonds offer average yields that are just 2.7% higher than comparable Treasuries. Considering that high-yield bonds are much riskier than U.S. Treasuries, that yield advantage is very slim.
High-yield bond spreads are historically low
Source: Bloomberg, using weekly data from 2/21/2005 to 2/21/2025.
Option-adjusted spreads (OAS) are quoted as a fixed spread, or differential, over U.S. Treasury issues. Indexes are unmanaged, do not incur management fees, costs and expenses, and cannot be invested in directly. Past performance is no guarantee of future results.
Spreads can be volatile, with the potential to rise or fall sharply over the course of a few weeks or months, depending on the economic outlook. When the economy is doing well, spreads tend to decline, as investors don't demand as much extra yield compensation, because the perceived risks of a company not being able to service its debt may be low, a perception that can apply to the corporate bond market as a whole. When the economic outlook deteriorates, however, spreads tend to rise as investors begin to demand higher yields to compensate for the rising risks, like the risk of default.
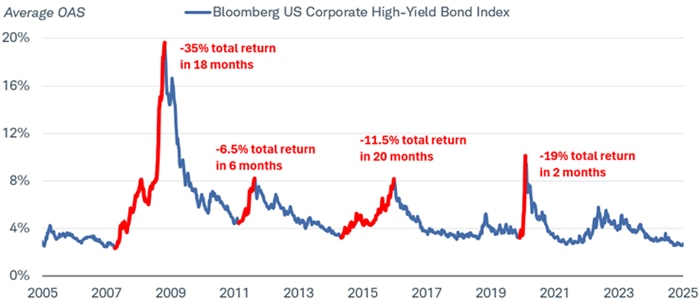
The chart below looks at that spread chart from above through a different lens. Prices fall relative to Treasuries when spreads rise, so total returns tend to suffer when spreads increase. That's why low spreads can be a risk over short run.
Rising spreads generally result in negative total returns
Source: Bloomberg, using weekly data from 2/21/2005 to 2/21/2025.
Option-adjusted spreads (OAS) are quoted as a fixed spread, or differential, over U.S. Treasury issues. Total return includes price growth plus interest income. Indexes are unmanaged, do not incur management fees, costs and expenses, and cannot be invested in directly. Past performance is no guarantee of future results.
Keep in mind that spreads tend to decline once a peak is hit, meaning prices often rebound. While there may be short-term pain, long-term investors can benefit over time if they hold onto their high-yield bond investments through the ups and downs, barring default.
Many investors focus on yield rather than spread, and yields for many investments are high today. The Bloomberg US Corporate High-Yield Bond Index, an index composed of sub-investment-grade-rated bonds, or "junk" bonds, currently offers an average yield-to-worst (the lowest possible yield that can be received on a bond with an early retirement provision) of more than 7%. Over time, the yield advantage has resulted in high total returns for those willing to ride out large price fluctuations.
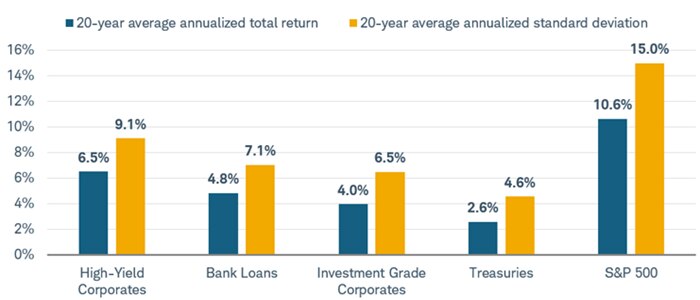
Over the last 20 years, the Bloomberg US Corporate High-Yield Bond Index has delivered an average annualized total return of 6.5%, two and half times more than that of the Bloomberg US Treasury Index. Those high returns came with almost double the volatility as well, as measured by the standard deviation. The high-yield bond volatility pales in comparison to the S&P 500, however, so even the riskier parts of the bond market have volatility that's more similar to Treasuries than to stocks.
The increase in yields in 2022 and 2023—and accompanying price declines—have had a relatively large impact on the 20-year average annualized return for Treasuries. For the 20-year period ending December 2021, before the Federal Reserve began its rate hike cycle, the average annualized return for Treasuries was 3.9%.
Risk / return
Source: Bloomberg, using monthly data from 1/31/2004 through of 1/31/2025.
Bloomberg US Corporate High-Yield Bond Index (LF98TRUU Index), Morningstar LSTA US Leveraged Loan 100 Index (Wtd Average Yield) (SPBDLLY Index), Bloomberg U.S. Corporate Bond Index (LUACTRUU Index), Bloomberg US Treasury Index (LUACTRUU Index), and the S&P 500 Total Return Index (SPXT Index). Standard deviation, commonly used as a measurement of risk, is a statistical measure that calculates the degree to which returns have fluctuated over a given time period. A higher standard deviation indicates a higher level of variability in returns. Indexes are unmanaged, do not incur management fees, costs and expenses, and cannot be invested in directly. Past performance is no guarantee of future results.
But keep in mind that high-yield bond issuers can and do default on their debts over time. Holders of individual high-yield bonds, and bond funds that hold those investments, may suffer some sort of principal loss if the bonds they hold default. As a result, long-term returns tend to be a bit lower than the initial stated yield. Over the past 20 years, the average yield-to-worst of the Bloomberg US Corporate High-Yield Bond Index was 7.6%, compared to the average annualized total return of 6.5%, highlighting how defaults can pull down returns over time.
Bank loans
Bank loans are a type of corporate debt with a number of unique characteristics that differentiate them from traditional corporate bonds. They go by a number of different names, including "leveraged loans" or "senior loans." What they share in common with high-yield bonds is their credit ratings—bank loans generally have sub-investment-grade credit ratings, meaning they have elevated credit risk.
Bank loans generally have asymmetric price risk. Prices can (and do) fall if there are concerns about the economy and the overall ability of loan issuers to repay their debt obligations. A plunge in price, shown in the chart below, is what drives the drawdowns shown in the chart above. But loan prices rarely rise above their $1,000 par values due to their call features. If a loan price were to rise to or above par, the issuer would likely refinance it with a new loan with better terms for the issuer.
Bank loan prices have dropped sharply at times

Source: Bloomberg. Data shown are from 2/21/2005 to 2/21/2025.
Indexes are unmanaged, do not incur management fees, costs and expenses, and cannot be invested in directly. Past performance is no guarantee of future results.
A key difference between bank loans and high-yield bonds is their coupon rates. While junk bonds generally pay fixed coupon rates, bank loans pay floating coupon rates. The coupon rates are usually based on a short-term reference rate, like the Secured Overnight Financing Rate (SOFR), plus a spread.
Floating coupon rates can limit an investment's interest rate risk, or "duration." Because their coupon rates reset when short-term interest rates move, their prices don't need to adjust the way a fixed-rate bond's price might adjust. That helps reduce the volatility of bank loan investments, as shown in the risk/return chart above. The average annualized volatility for the Morningstar LSTA Leveraged Loan Index is roughly 30% less than the high-yield index.
That volatility can also be seen through the lens of rolling two-year total returns. The chart below highlights how the rolling two-year total returns of the bank loan index is historically more stable than the high-yield index. Aside from the 2007-2008 financial crisis and the sharp decline at the beginning of the COVID-19 pandemic, bank loan returns have been generally positive for two-year holding periods. Bank loans do have a bit more volatility, and the discrepancy from 2022 through 2024 highlights their low interest-rate risk. Fixed-rate bonds, like high-yield bonds, generally suffered when the Federal Reserve began aggressively hiking interest rates in 2022, while bank loans saw more modest price declines and the two-year total returns stayed in positive territory.
Rolling returns

Source: Bloomberg. Data shown are from 2/21/2005 to 2/21/2025.
Y axis is capped at 60% for visual purposes; the peak for the blue line was 101% on 12/10/2010 and the peak for the yellow line was 70% on 12/17/2010. Past performance is no guarantee of future results. Indexes are unmanaged, do not incur management fees, costs, and expenses, and cannot be invested in directly.
Bank loans can benefit as the Federal Reserve holds its benchmark interest rate above 4%. Bank loan reference rates like SOFR are highly correlated to the federal funds rate, and with average spreads around 3% (or 300 basis points), average bank loan coupon rates are generally in the 7.25% to 7.5%. Even if the Fed cuts rates one or two more times later this year, average coupon rates should still be near 7%.
Finally, the fundamental backdrop for corporate bond investments is strong. Corporate profits remain near their all-time highs, corporate balance sheets are strong on average, and high demand for corporate bonds has allowed many corporations to successfully refinance their maturing debts.
Rising borrowing costs haven't had the negative effect on corporate profitability that many may have expected since so many companies issued or refinanced their debt at historically low rates in 2020 and 2021. Over time, the current level of borrowing costs can begin to eat into profits, but, in aggregate, companies generally have a lot of liquid assets on their balance sheets. According to data from the Federal Reserve, nonfinancial U.S. corporations have $1.02 in liquid assets for every $1 in short-term liabilities. That can help serve as a cushion should the economic outlook deteriorate. It wouldn't prevent the prices of bank loans or high-yield bonds from falling altogether, but it could help limit the downside.
Liquid assets can serve as a cushion

Source: Bloomberg, Federal Reserve. Data shown are from 6/1/1984 to 9/1/2024.
FOF Nonfarm Nonfinancial Corporate Business Liquid Assets (NFCBCBLA Index) and FOF Nonfarm Nonfinancial Corporate Business Total Short Term Liabilities (NFCBTSTL Index). Past performance is no guarantee of future results. Indexes are unmanaged, do not incur management fees, costs and expenses, and cannot be invested in directly.
What to consider now
We continue to suggest an "up in quality" fixed income bias for the short run, but investors can still consider some of the riskier parts of the market in moderation.
Low spreads mean there's little cushion should the economic outlook deteriorate, so investors considering high-yield bonds or bank loans should be prepared to invest for the long run and be able to ride out the potential ups and downs. Over time, investors who can stomach that volatility have generally been rewarded with high returns.
About the author